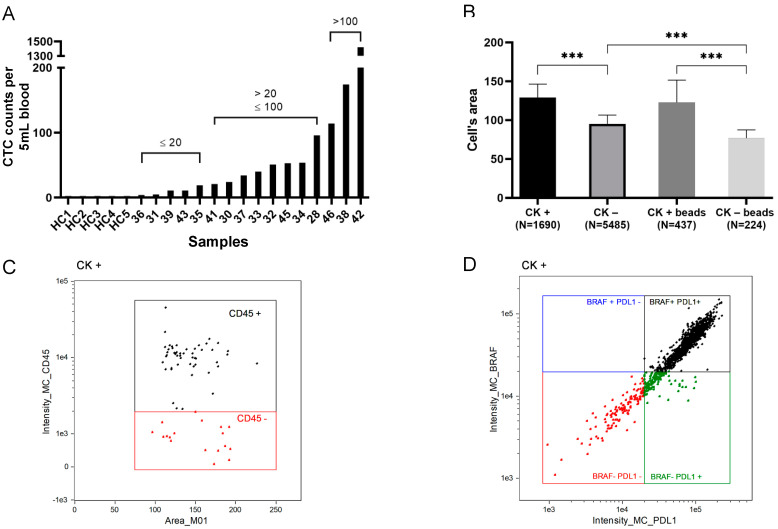
Figure 3.
Circulating tumour cell (CTC) enumeration and characterisation based on cytokeratin (CK) expression. (A) The number of CTCs in 5 mL of peripheral blood (y-axis) per patient and healthy controls (HC) ordered by increasing cell counts (x-axis). Asterisk represents 5 healthy controls. (B) Mean size (in µm) comparison of cells depending on CK expression of either single cells (CK+/CK−) or CTCs attached to beads (CK+ beads/CK− beads). Number of cells used to calculate mean size is shown in brackets. (C) A scatter plot example of the CK+ population of a patient based on CD45 expression. (D) Characterisation of CTCs based on BRAFV600E and PD-L1 expression. *** p value is <0.001 for ANOVA test followed by Turkey’s post hoc analyses.

