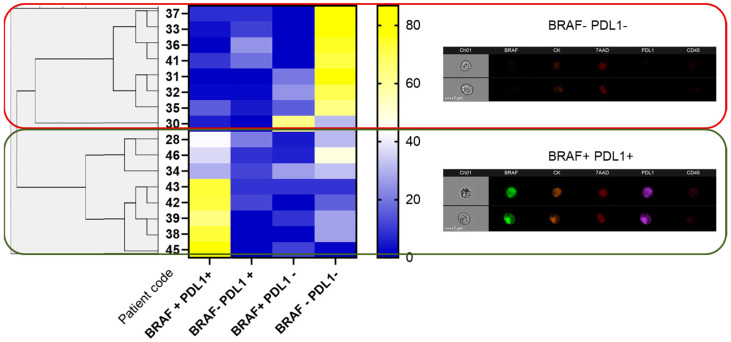
Figure 4.
Characterisation of CTC subpopulations from CRC patients based on BRAFV600E and PD-L1 expression. The left part of the figure shows a hierarchical cluster between groups, the middle part shows a heatmap representing percentages of either BRAFV600E and/or PD-L1 expression and the right part shows an example of two CTCs belonging to each of the main subpopulations, either double-negative (BRAFV600E−/PD−L1−) or double-positive (BRAFV600E+/PD-L1+).

