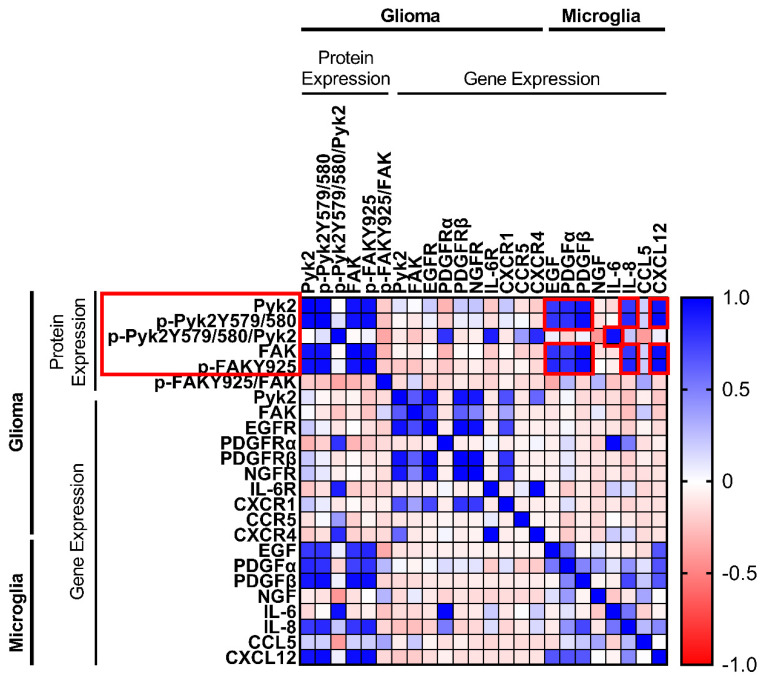
Figure 1.
Heat map of Pearson correlation matrix for microglia cytokine and chemokine gene expression and the corresponding cell-surface receptor gene expression, as well as Pyk2 and FAK gene and protein expression in human glioma cells. Cytokines/chemokines with a strong correlation (+0.6–+1.0) selected for further study are highlighted in red (n = 20).

