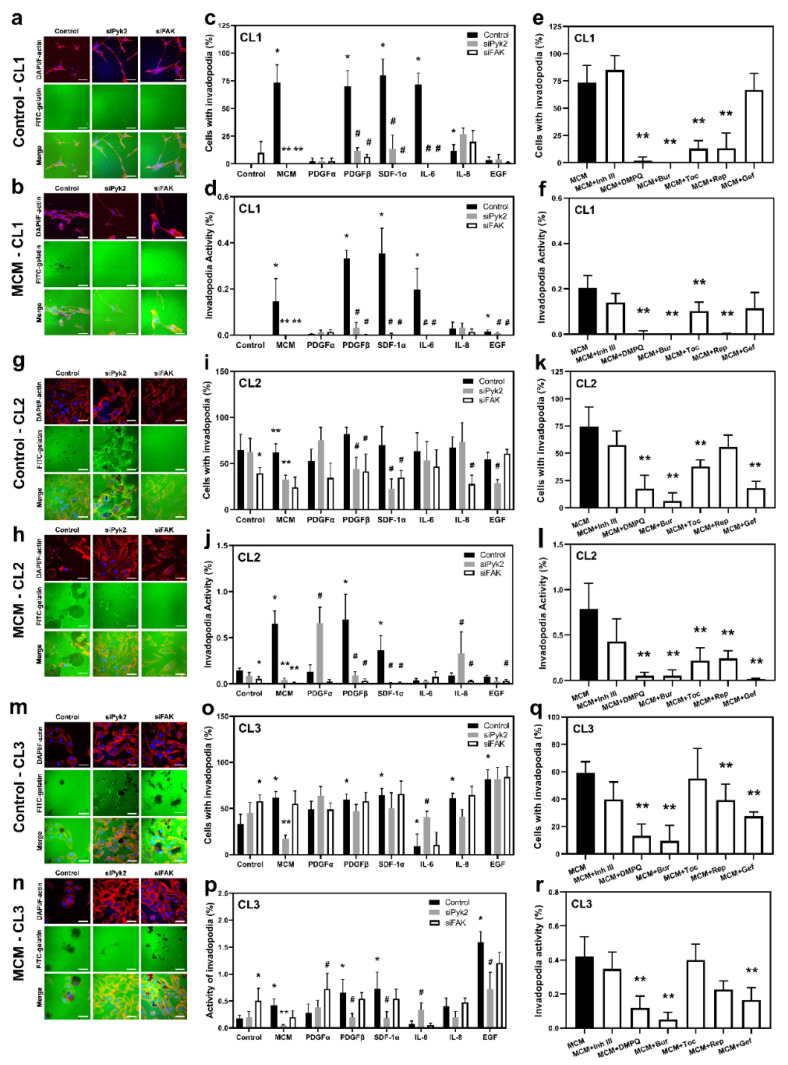
Figure 3.
Functional invadopodia formation is enhanced by microglia-derived cytokines and chemokines through Pyk2 and FAK signaling. Fluorescent matrix degradation and invadopodia formation experiments were performed to measure the invasiveness of glioma cells. Representative confocal images of F-actin (rhodamine–phalloidin, red), gelatin (FITC, green), and nuclei (DAPI, blue) under control (a,g,m) and microglia-conditioned medium (MCM; (b,h,n)) conditions are shown for cell lines CL1, CL2, and CL3. Degraded areas of FITC-labeled gelatin are visible as black patches. Oil immersion objectives (40×) were used. Scale bar, 50 µm. The percentage of cells with invadopodia (c,e,i,k,o,q) and invadopodia activity (d,f,j,l,p,r) were calculated for control (black bars), after treatment with cytokines in the presence or absence of siPyk2 (gray bars) and siFAK (white bars) and MCM with or without inhibitors. The values are shown as means ± SD for 3–6 experiments per group. * p < 0.05 vs. control, ** p < 0.05 vs. MCM, # p < 0.05 vs. the corresponding cytokine. Inh III, inhibitor III; Bur, burixafor; Toc, tocilizumab; Rep, reparixin; and Gef, gefitinib.

