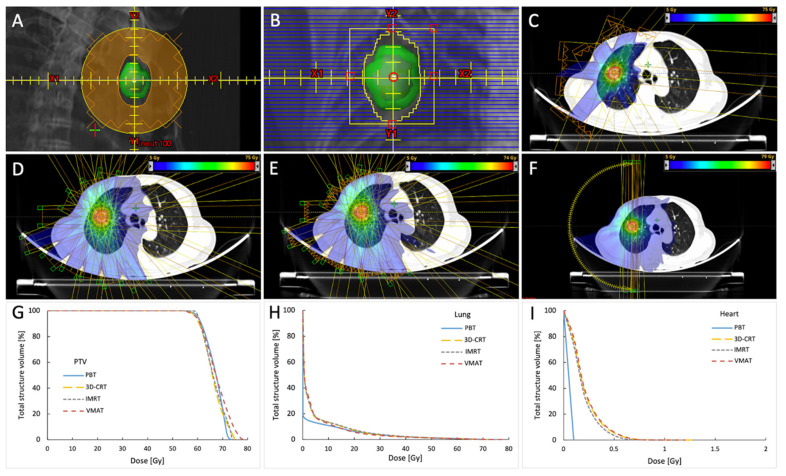
Figure 1.
Examples of block and MLC settings, each treatment plan’s dose distributions and beam arrangements, and dose–volume histogram for the PTV, lung, and heart for the peripherally located tumor treated with 60 Gy in 4 fractions. The GTV is showed in red, iGTV in magenta, and PTV in green contours. Blocks were made with 1–3-mm lateral margins and 7 to 8-mm superior–inferior margins with respect to the PTV (shown in the green structure; the reddish structure inside is iGTV) (A). MLC was set manually for 3D-CRT, and no additional margin was added at the x-axis edges, and 0.7 cm was added to the y-axes of the MLC (B). Examples of dose distributions and beam arrangements for the PBT (C), 3D-CRT (D), IMRT (E), and VMAT (F) plans. Corresponding dose–volume histogram for PTV (G), the lung (H), and the heart (I). MLC, multileaf collimator; PTV, planning target volume; PBT, proton beam therapy; 3D-CRT, three-dimensional conformal radiotherapy; IMRT, intensity-modulated radiotherapy; VMAT, volumetric-modulated arc therapy.

