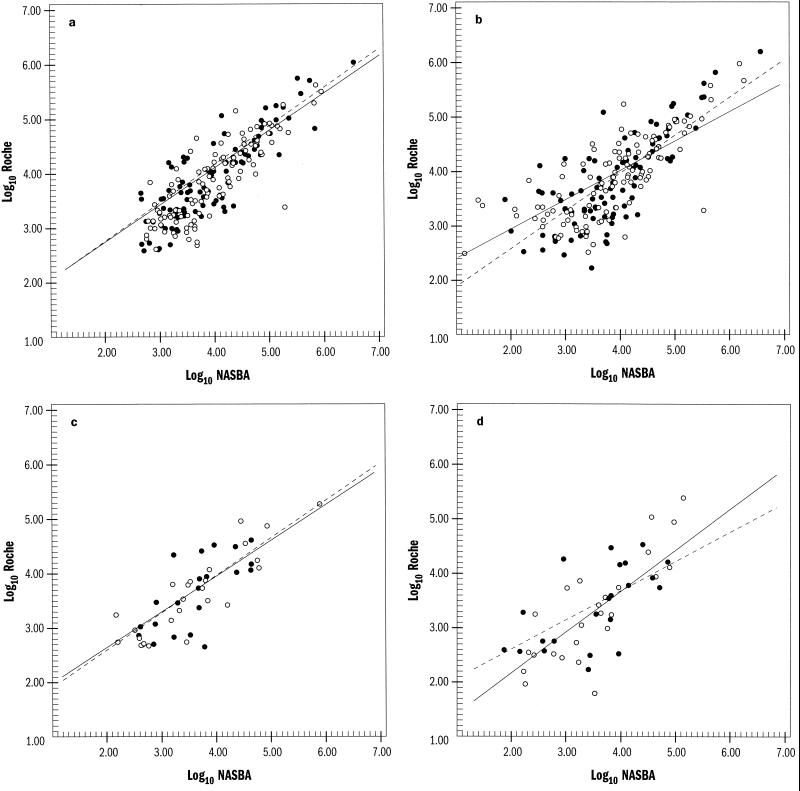
FIG. 1.
Linear regression analysis of the OTC and Roche assays for kit (a and c)- and VQA (b and d)-adjusted values for peripheral blood (a and b) and genital tract (c and d). Log10 RNA values from the Roche assay are plotted against those of the NASBA-QT (○) and NucliSens (●) assays. Linear regression correlation for the NASBA and NucliSens assays (——) is shown, compared to a slope of 1 (–––).

