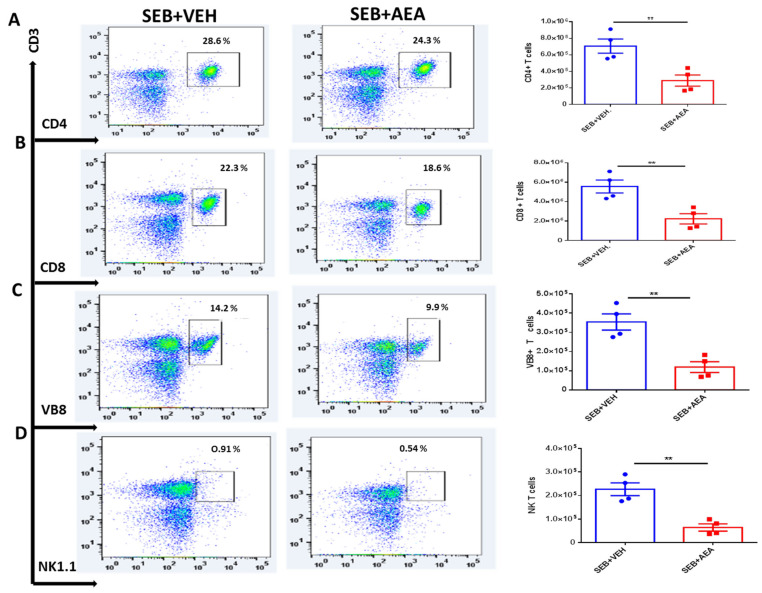
Figure 3.
AEA decreases T cell subpopulations in the MLN. Mice were treated with SEB and AEA as described in the Figure 1 legend. Each panel shows a representative experiment depicting MLN analyzed for percentages of various T cell markers. The data on total cellularity from four mice per group is presented in the form of vertical bars with mean +/− SEM. (A) CD3 + CD4 + T cells. (B) CD3 + CD8 + T cells. (C) CD3 + Vβ8 + T cells. (D) CD3 + NK1.1 + cells. Data presented are representative of three independent experiments. A Student’s t-test was used to compare the two groups and the statistical significance was indicated as follows: ** p ≤ 0.01.

