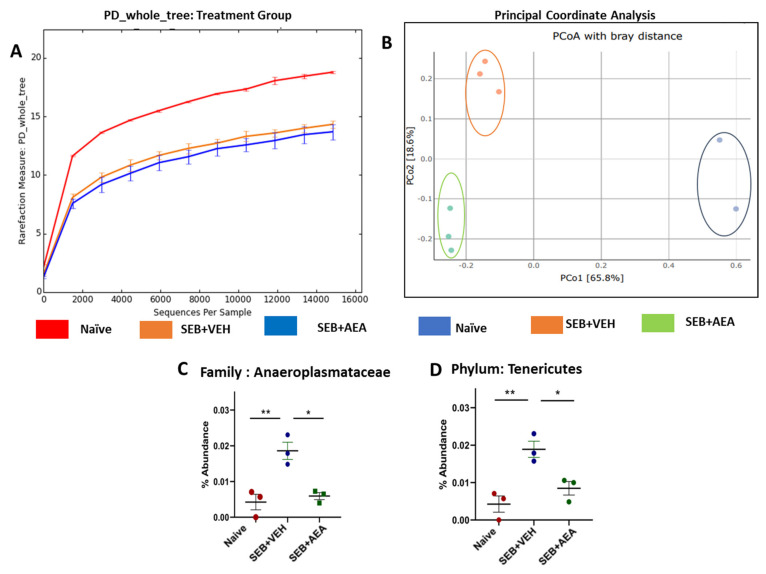
Figure 7.
Effect of AEA on the abundance of microbiota in colon/cecal flush of mice with SEB-mediated ARDS. Mice were treated with SEB and AEA, as described in the Figure 1 legend. The samples of cecal flush were collected and, using 16S rRNA sequencing and the Nephele platform, the data were analyzed. (A) Rarefaction curves depicting alpha diversity within groups (Chao1 index). (B) Principal coordinate analysis which reveals the clustering of bacteria in lungs based on their 16S rRNA content similarity. GraphPad Prism was used to analyze the abundancy of microbiome in panels (C,D). Data in panels (C,D) represent mean ± SEM from three mice/group. While three mice were also used in panel B, the sequence reads for one of the samples in the naïve group did not meet the threshold for PCOA, thereby showing two samples, while this sample qualified enough for the Chao index, abundancy, and LEfSe analysis. Significant differences between groups were calculated using one-way ANOVA with post hoc Tukey’s test. Significance is indicated as follows: * p < 0.05, ** p < 0.01.

