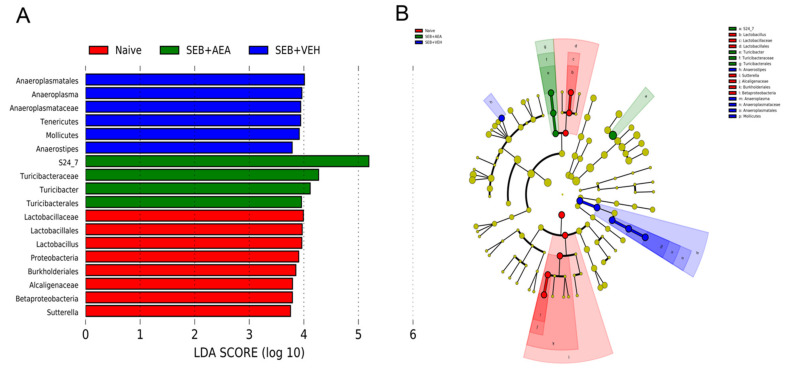
Figure 8.
Linear discriminant analysis of effect size (LEfSe) in the cecal flush of mice with ARDS. Mice were treated with SEB and AEA, as described in the Figure 1 legend. (A) LEfSe-generated linear discrimination analysis (LDA) scores for differentially expressed taxa. (B) LEfSe-generated cladogram for operational taxonomic units (OTUs) showing phylum, class, order, family, genus, and species from outer to inner swirl. For LEfSe data, the alpha factorial Kruskal–Wallis test among classes was set to 0.05, and the threshold on the logarithmic LDA score for discriminative features was set at 3.

