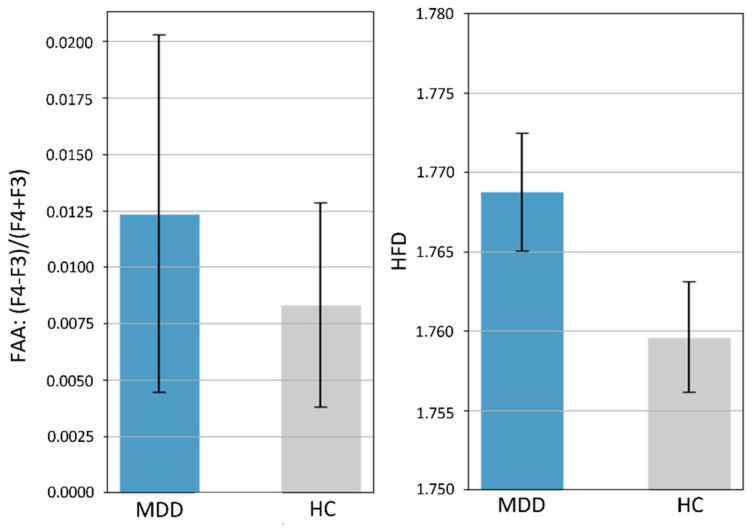
Figure 7.
Means and 95% error bars (standard error of the mean) for MDD and HC participants. Left: frontal alpha asymmetry (FAA) calculated by the ratio (F4 − F3)/(F4 + F3) of alpha power. Right: EEG complexity represented by the HFD with kmax = 50. There were no significant differences in FAA (p = 0.66) and HFD-based complexity (p = 0.07) between the MDD and HC groups.

