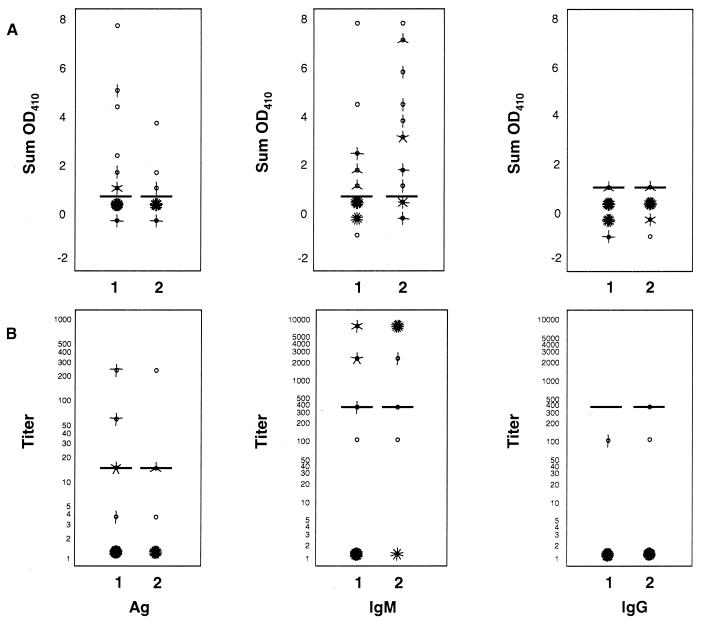
FIG. 1.
Lassa virus antigen (Ag), IgM, and IgG antibody findings from first and second samples drawn from 50 patients with culture-confirmed Lassa fever. (A) Adjusted optical density (Sum OD410). (B) Titers assigned to each serum specimen. Horizontal bars represent the cutoff for a positive result for each assay. Each “petal” of a “sunflower” ( ) represents a patient. Sunflowers without petals represent a single case. Titers are expressed on a log10 scale. The numbers of specimens in various categories are not equal because not all patients had two blood samples drawn.

