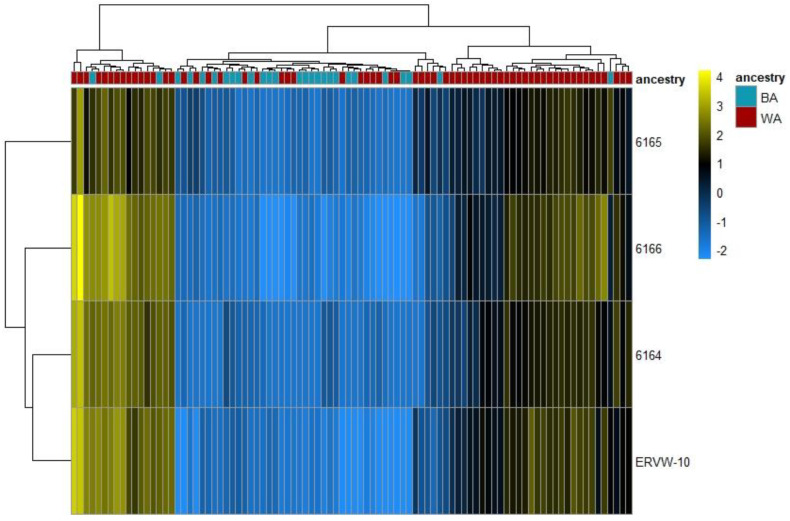
Figure 1.
Four most differentially expressed ERVs among Black and White Americans. ERVs from 92 tumor-enriched PCa samples were mapped to the ERVmap database. Differential expression analysis and hierarchical clustering analysis (Euclidean) was performed in DeSeq2 to organize tumor samples based on their ERV transcription profiles and the ancestry of the PCa patients. The heat map represents the hierarchical clustering of the four significantly differentially expressed ERVs (padj < 0.1) and had a |log2(FC)| > 2 in BA (n = 27) vs. WA (n = 65). Each column represents one sample and each row represents a single ERV. The ERV expression is depicted as a color intensity (−2.0 to 4.0) on a log scale; yellow indicates ERVs with higher expression and blue indicates lower expression. Expression was normalized to the mean of all samples. In the dendrogram on top, the ancestral origin of each patient is indicated by color. Red indicates patients of predominantly European (n = 54) or Middle Eastern (n = 11) geographical ancestries while blue represents patients of African ancestry.

