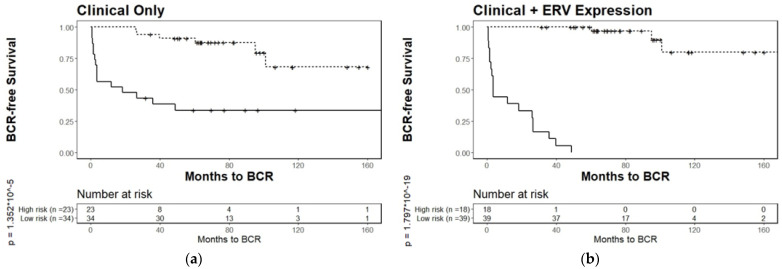
Figure A1.
Kaplan–Meier plots for biochemical relapse of a training set of PCa patients stratified by prognostic models based on (a), clinical data alone, or (b), clinical data + 29-ERV panel. Tumor-enriched samples from PCa patients from the Atlanta VA Medical Center (n = 57) were separated into two risk groups based on biochemical relapse. The prognostic model applied in (b) (p = 1.797 × 10⁻¹⁹) outperforms clinical parameters alone, in (a) (p = 1.352 × 10⁻⁵), and consists of 29 ERVs, identified using survival analysis based on a Lasso-Cox proportional hazard model, combined with the same clinical variables used in model (a).

