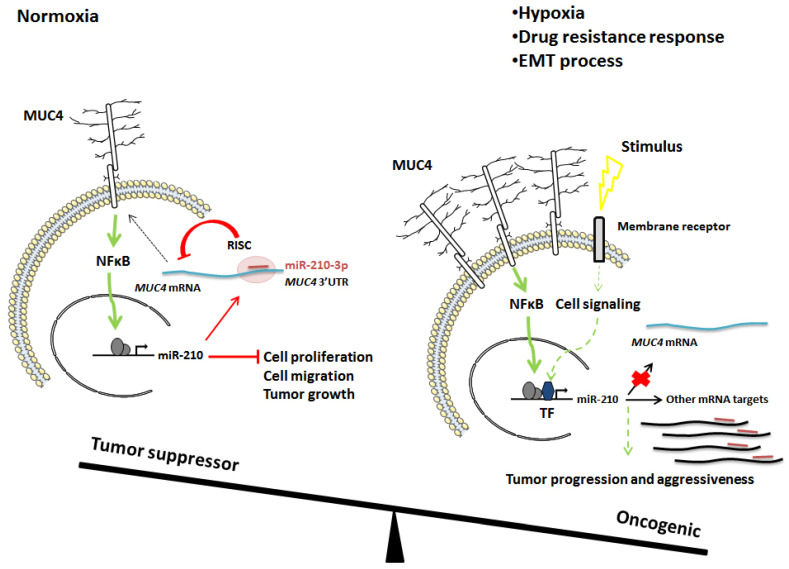
Figure 8.
Schematic representation of overall miR-210-3p tumor suppressor/oncogenic effects in PDAC cells. Left: MUC4-miR-210-3p negative feedback loop that we identified under normoxic conditions. Right: Hypothetical model of miR-210-3p regulation and roles under hypoxia, drug resistance or metastasis signaling. Green arrows represent activating signals. Red arrows represent inhibitor signals. Short red line represents miR-210-3p. RISC: RNA-induced silencing complex. TF: transcription factors.

