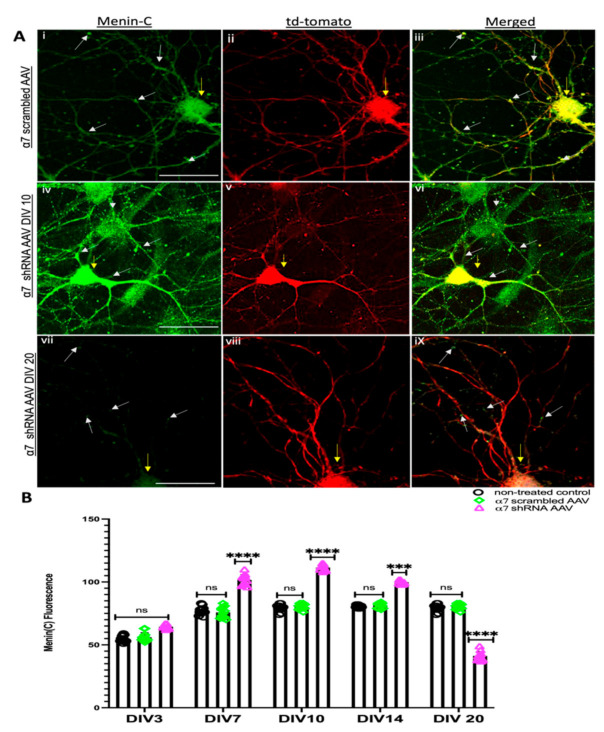
Figure 3.
Menin protein expression increases initially and decreases later in α7 KD neurons (in vitro). (A) High-magnification (60×) confocal image of a α7 KD hippocampal neurons (Aiv–ix) compared to scrambled controls (Ai–iii) on DIV 10 and DIV 20 (Avii–ix), respectively (n = 30 images, six independent samples, representative image). tdTomato-positive cells (Aii,v,viii) labelled with α-C-terminal menin (Ai,iv,vii) and merged (Aiii,vi,ix). (Aiv) exhibits the augmented expression of α-C-terminal menin in tdTomato-positive cells on DIV 10, whereas (Aviii) displays a reduced expression of α-C-terminal menin expression and puncta in tdTomato-positive cells on DIV 20. Scale bars, (Ai–iii) 12, (Aiv–vi) 15 and (Avii–ix) 10 μm. (B) Summary data, normalized C-menin protein expression in neuronal soma and neurites from scrambled shRNA and α7-KD hippocampal cultures compared to untreated controls (n ≥ 15 images, ≥6 independent samples, DIV 3, 7, 10, 14, 20). Yellow arrowheads indicate tdTomato-positive neurons. White arrowheads indicate C-menin-positive puncta. Statistical significance (one-way ANOVA followed by Tukey’s multiple comparison test) **** p < 0.0001, *** p < 0.001, ns p > 0.9999. See Supplementary Table S4.

