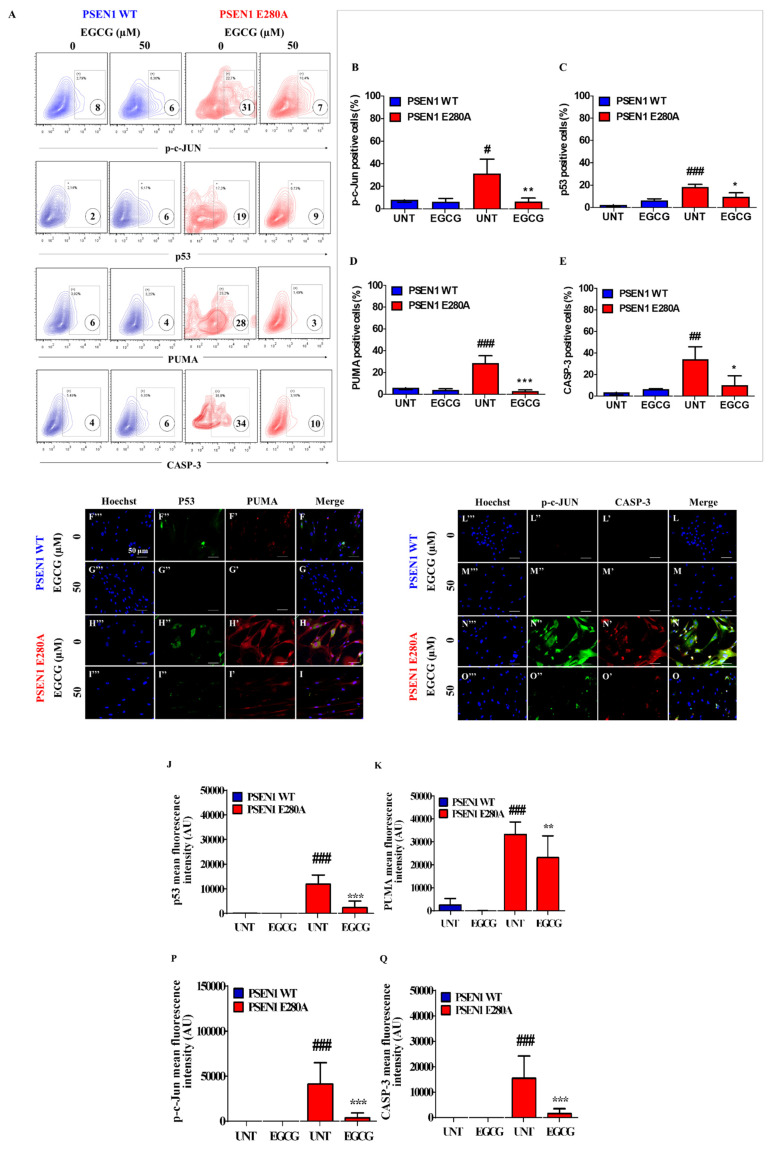
Figure 3.
EGCG reduced the activation of P53, PUMA, c-JUN, and CASPASE-3 in PSEN1 E280A ChLNs. After 7 days of transdifferentiation, WT PSEN1 and PSEN1 E280A ChLNs were left untreated or treated with EGCG in a regular culture medium for 4 days. Then, cells were labeled with primary antibodies against c-JUN/total c-JUN, P53, PUMA, CASPASE-3 (CASP-3), and fluorescent secondary antibodies. The fluorescent contour plot shown in (A) were quantified (B–E). Additionally, cells were double-stained as indicated in the figure (F–O) with primary antibodies against P53 (green; F”–I”), PUMA (red; F’–I’), c-JUN (green; L”–O”), and CASP-3 (red; N’–O’). The nuclei were stained with Hoechst 33,342 (blue; F’’’–O’’’). (J,K,P,Q) Quantification of P53 (J), PUMA (K), c-JUN (P), and CASP-3 (Q) fluorescence intensity. Data are expressed as the mean ± SD; #,* p < 0.05; ##, ** p < 0.01; ###, *** p < 0.001; ### represents differences compared to UNT PSEN1 WT cells; **,*** represents differences compared to UNT PSEN1 E280A cells. The figures represent 1 out of 3 independent experiments. Image magnification, 200×.

