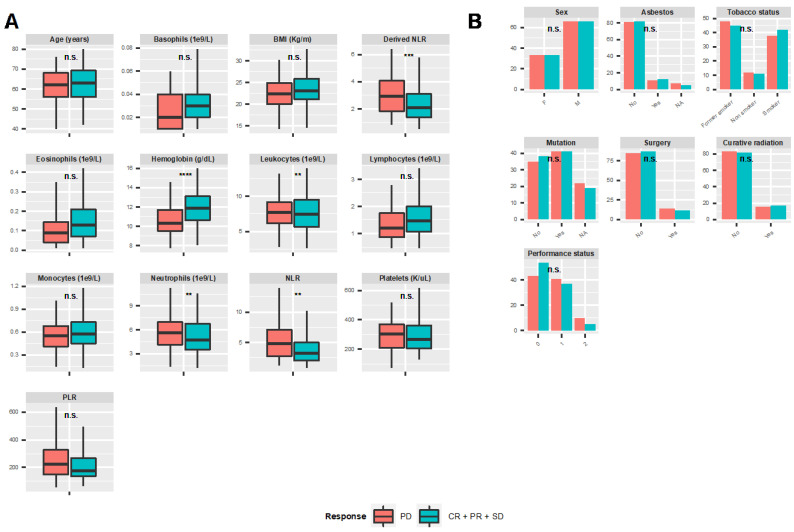
Figure 1.
Exploratory data analysis. (A) Boxplots of continuous variables. (B) Barplots of categorical variables. BMI = body mass index, NLR = neutrophil-to-lymphocyte ratio, PLR = platelets-to-lymphocytes ratio, CR = complete response, PR = partial response, SD = stable disease and PD = progressive disease. Stars indicate statistical significance: **: p < 0.01, ***: p < 0.001, ****: p < 0.0001, n.s. = non-significant.

