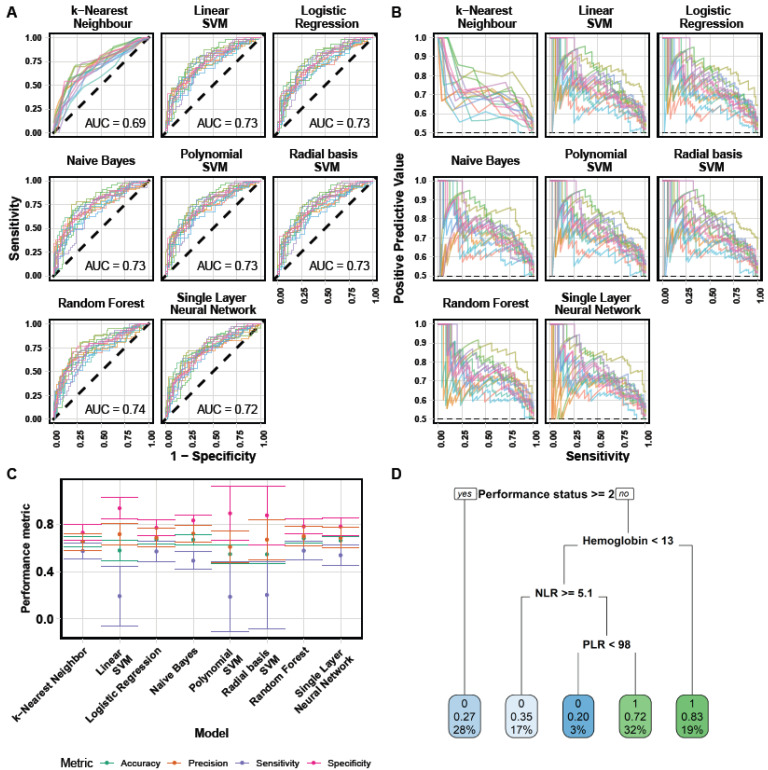
Figure 3.
Machine learning algorithms predictive performances. (A) Receiver-operator curves for prediction on test sets from each fold of the outer cross-validation loop, for each model. AUC = area under the curve. (B) Precision (positive-predictive value)–recall (sensitivity) curves. (C) Main performance metrics for each algorithm. (D) Decision tree obtained after tuning and training. Each node shows: the predicted class (0 = PD, 1 = CR + PR + SD), the predicted probability of response and the percentage of total observations in the node.

