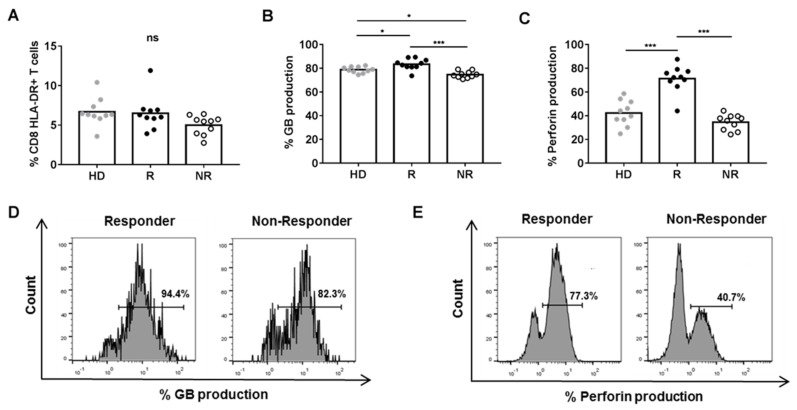
Figure 2.
Phenotype and cytotoxic function of CD8+ HLA-DR+ T cells after a 72 h-culture of HD (n = 10) PBMCs with 25% plasma from R (n = 10) and NR (n = 10) BC patients. (A) Percentage of CD8+ HLA-DR+ T cells (B) Percentage of CD8+ HLA-DR+ T cells producing granzyme B (GB). (C) Percentage of CD8+ HLA-DR+ T cells producing perforin. (D) Representation of a flow cytometry analysis of granzyme B expression and, (E) perforin expression in cultures with plasma from R and NR patients. * p < 05; *** p < 0.001.

