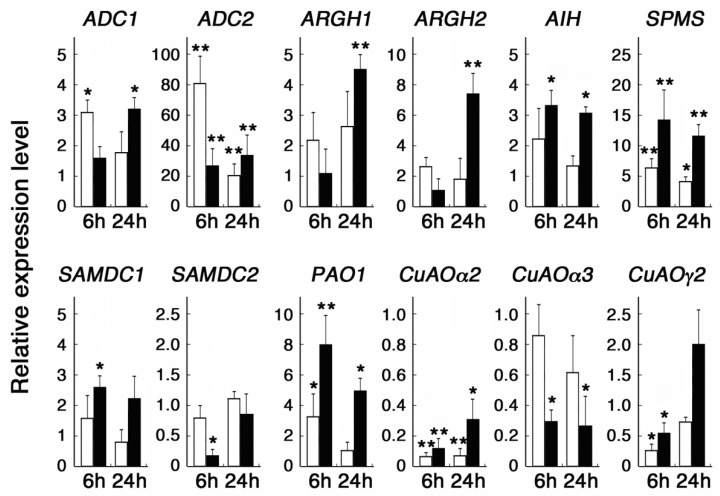
Figure 1.
Effect of MeSA and NaSA on polyamine metabolic genes. Seven-day-old seedlings grown in liquid MS solution were further incubated with 1mM MeSA (white bars) or NaSA (black bars) for 6 and 24 h. Transcript levels relative to the control of no SA treatment are shown. Data are expressed as mean values ± SD (n = 6). Asterisks indicate the statistical significance analyzed with Student’s t-test, (* p < 0.05, ** p < 0.01).

