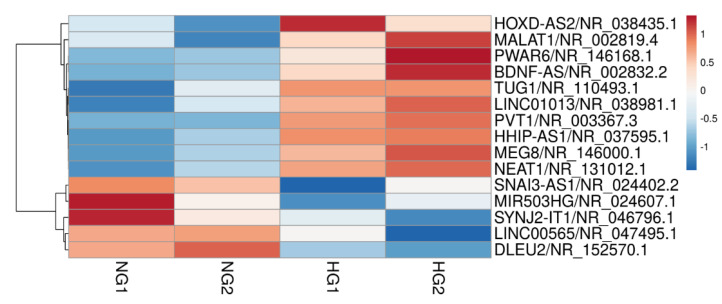
Figure 1.
Heatmap analysis of LncRNAs in HRECs incubated in high glucose. RNA sequencing was performed in the nuclear fraction of the cells incubated in normal and high glucose; the figure represents a heatmap of two different cell preparations, each incubated in 5 mM d-glucose (NG1 and NG2) and in 20 mM d-glucose (HG1 and HG2).

