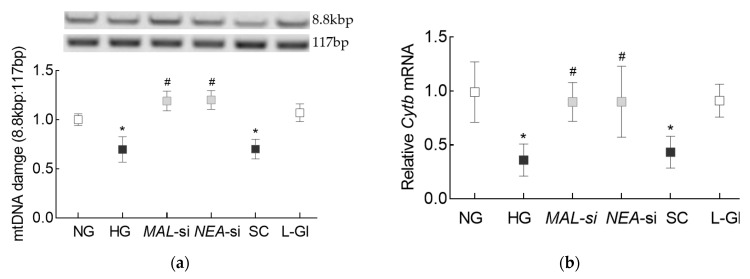
Figure 6.
Mitochondrial DNA damage and or LncNEAT1. (a) Mitochondria DNA damage was quantified by extended-length PCR using long mtDNA (8.8 kbp) and short (117 bp) amplicons of the mtDNA. (b) Cytb gene transcripts were quantified by qRT-PCR using β-actin as the housekeeping gene. Each measurement was made in duplicate/triplicate in 3–4 different cell preparations, and the histograms represent values as mean ± SD. NG = 5 mM d-glucose; HG = 20 mM d-glucose, MAL-si, NEAT-si and SC = Cells transfected with MALAT1-siRNA, NEAT1-siRNA, or scrambled control RNA respectively, and incubated in 20 mM d-glucose, L-Gl = cells in 20 mM l-glucose. * and # p < 0.05 vs. NG and HG respectively.

