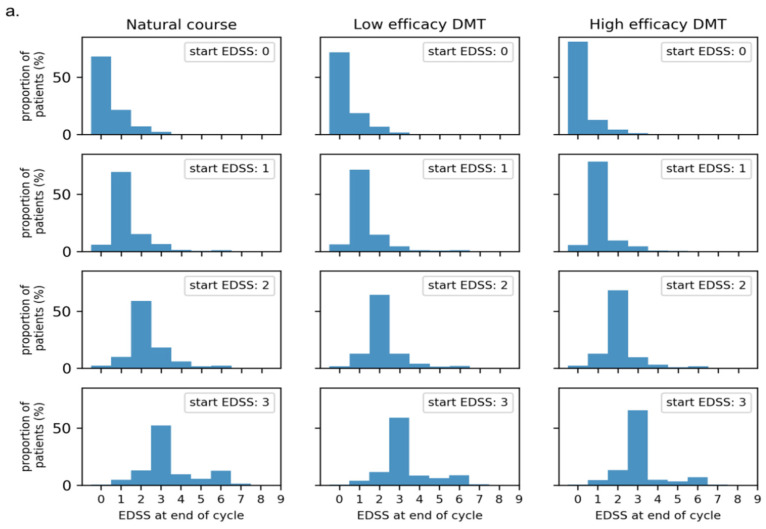
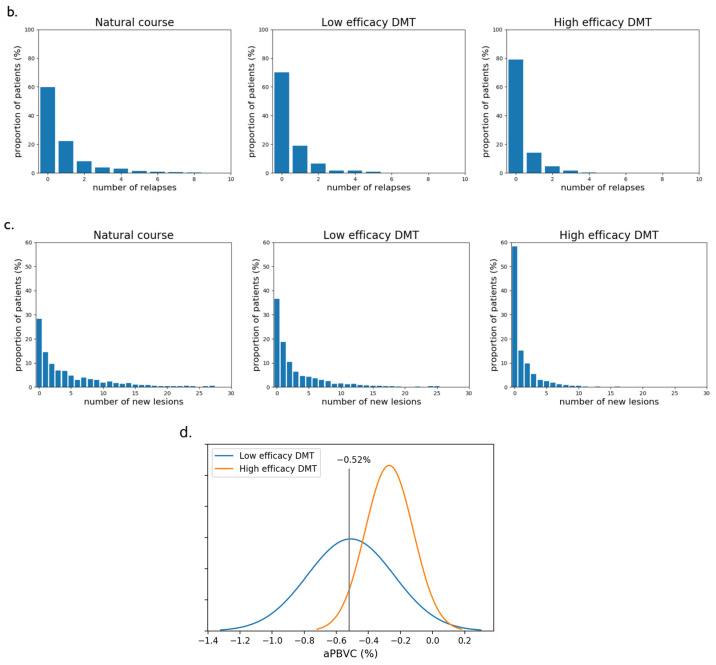
Figure A1.
Distribution of simulated disease activity parameters. For comparison purposes, we show the untreated MS (natural course) distributions, together with those modulated by low or high efficacy DMTs. Efficacy rates are randomly generated to be representative for a whole family of DMTs, as specified in Table 2, and are thus not specific for a single DMT. (a) EDSS transitions showing the proportion of patients moving to the next EDSS state at the end of a cycle, when the EDSS at the beginning of the cycle was 0, 1, 2, or 3; (b) histograms of the number of relapses during one cycle, assuming an EDSS of 1; (c) histograms of the number of new lesions during one cycle; (d) Gaussian distributions of aPBVC for healthy controls, which is also used as target distribution for high efficacy DMT, and (untreated or on low efficacy DMT) MS patients. The −0.52% threshold giving 5% ‘false positives’ is illustrated (from [22]). With a mean of the MS distribution at −0.51%, the ‘sensitivity’ for this threshold is 49%.


