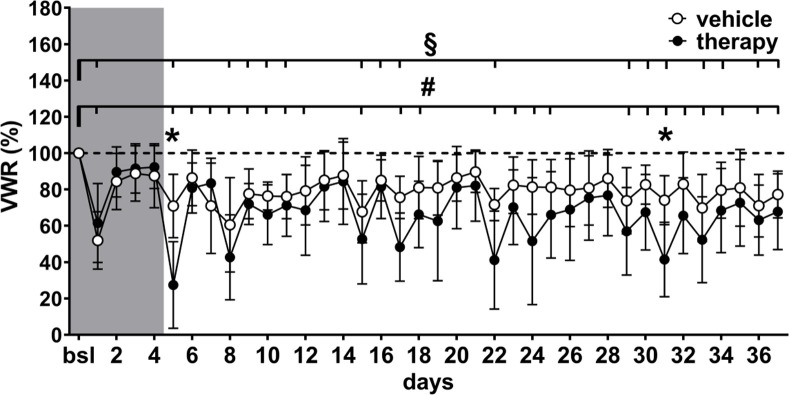
Fig 5. Course of VWR.
VWR activity with days of significant differences between groups (day 5 and 31; * = comparison between both groups, linear mixed-effects model, fixed effects (type III) for group: p = 0.0927, F (1, 18) = 3.157 with Bonferroni‘s multiple comparisons test p < 0.05); compared to baseline, differences were detected in both groups, however, the frequency was higher in the therapy group (# = therapy, linear mixed-effects model, fixed effects type III: p < 0.0001, F (3.988, 35.90) = 13.12, Dunnett’s multiple comparisons test p < 0.05; § = vehicle, linear mixed-effects model, fixed effects type III: p < 0.0092, F (3.922, 32.12) = 4.068 Dunnett’s multiple comparisons test p < 0.05).

