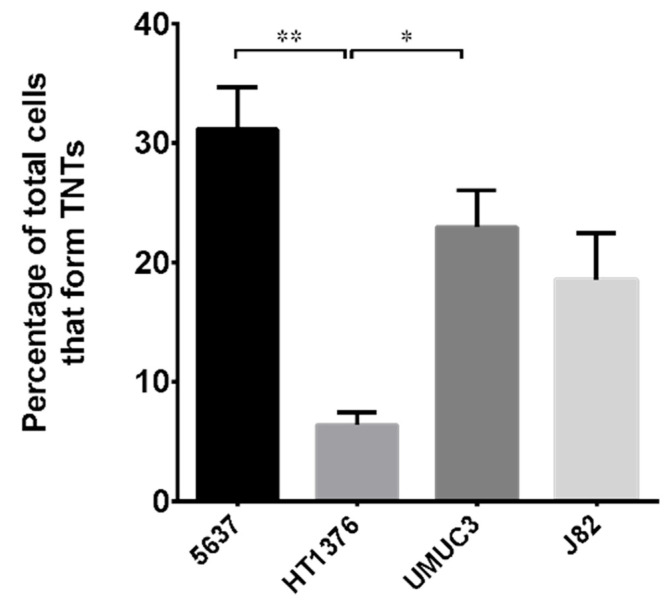
Figure 2.
Percentage of cells forming TNTs in different bladder cancer cell lines. 5637, HT1376, UMUC-3 and J82 cell lines were plated as described in Figure 1, imaged by Operetta CLS™ and scored for the presence of nanotubes. At least 200 cells were analyzed per group in three independent experiments. Data are expressed as mean ± S.E.M. from three independent experiments. Differences among groups were analyzed using a one-way analysis of variance (ANOVA) followed by Tukey’s post hoc test. * p < 0.05, ** p < 0.01.

