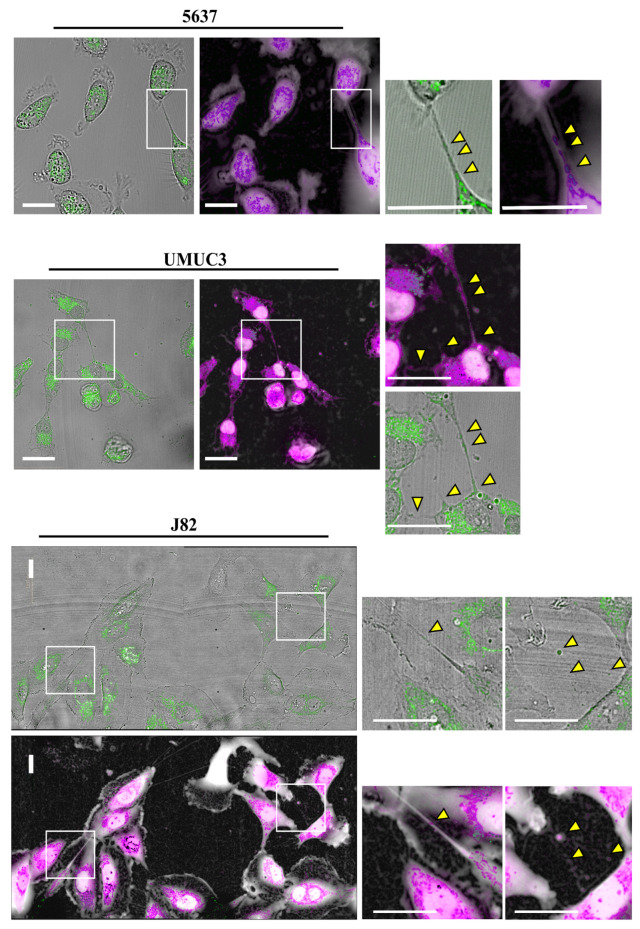
Figure 3.
Mitochondrial transfer via TNTs in bladder cancer cell lines. 5637, UMUC-3 and J82 cells were plated at a density of 1 × 10⁴ cells/well on Cell Imaging 24-well Plates. After 24 h, cells were stained with MitoTracker™ Green and live cell images were acquired using Operetta CLS™, equipped with 63× immersion objective in brightfield, DPC and fluorescence, to detect MitoTracker. Scale bar: 20 µm. Yellow triangles indicate mitochondria. Magnified views of mitochondria inside nanotubes are shown.

