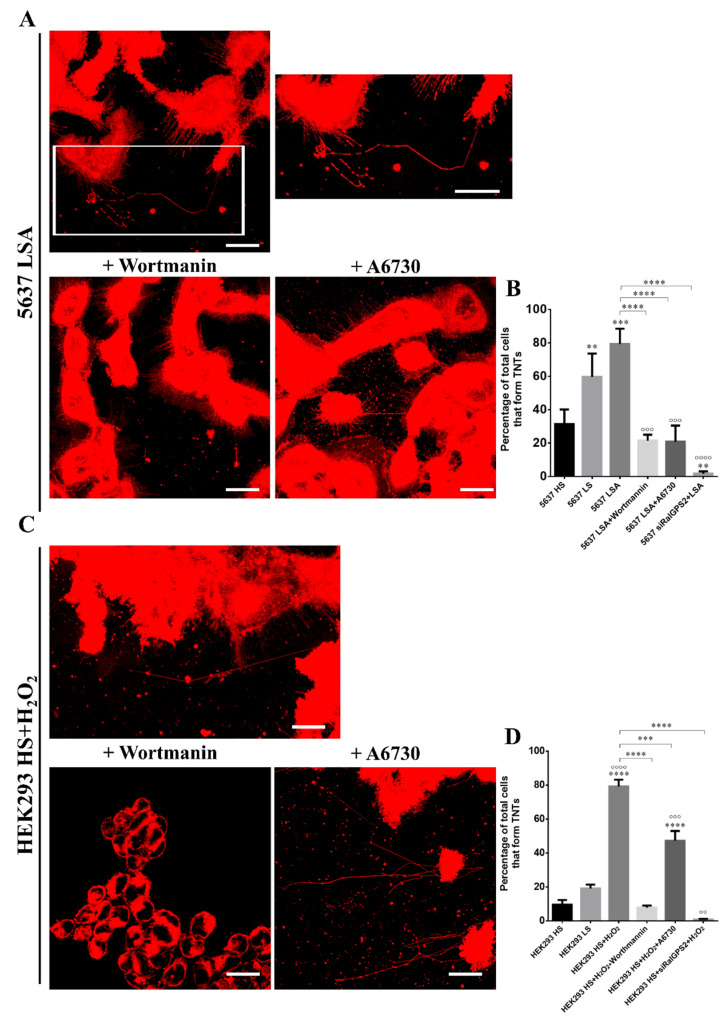
Figure 11.
Effect of PI3K and Akt inhibition under stress conditions on TNTs formation. (A) 5637 and (C) HEK293 cells were plated at a density of 1 × 10⁵ cells/mL on porcine gelatin pre-treated coverslips. The next day the medium was replaced with LSA or HS+H2O2, respectively, and 24 h later, the cells were treated with or without 100 nM Wortmannin or 10 µM A6730, as indicated in each panel. After 1h of treatment, cells were stained with the membrane dye DiI, fixed, permeabilized and imaged via confocal microscopy. Scale bar: 20 µm. Magnified views of nanotubes are shown. Histograms relative to the percentage of cells forming TNTs in (B) 5637 and (D) HEK293 cells. At least 200 cells were analyzed per group in three independent experiments. Data are expressed as mean ± S.E.M. from three independent experiments. Differences among groups were tested for significance by the one-way analysis of variance (ANOVA) followed by Tukey’s post hoc test. ** p < 0.01, *** p < 0.001, **** p < 0.0001. °° p < 0.01, °°° p < 0.001, °°°° p < 0.0001 significance compared to LS. HS (25 mM glucose, 10% FBS, pH 7.4) = High Serum; LS (25 mM glucose, 2.5% FBS, pH 7.4) = Low Serum; LSA (50 mM glucose, 2.5% FBS, pH 6.6) = Low Serum Acidified; HS+H2O2 (25 mM glucose, 10% FBS, pH 7.4, 100 µM H2O2).

