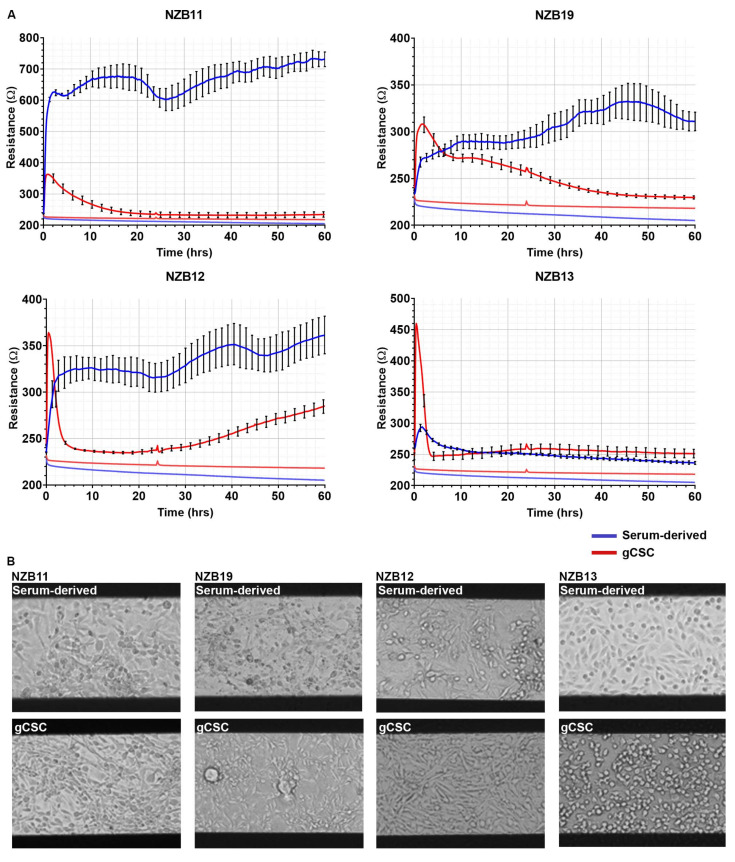
Figure 3.
Serum-derived and gCSC cell resistance on 96W20IDF ECIS arrays. (A) Resistance measurements at 4000 Hz over 60 h of growth. Comparison of adhesion profiles of NZB11, NZB12, NZB19, and NZB13 serum-derived and gCSC cells seeded at 80,000 cells. Adhesion profiles referenced against a cell-free control (bottom flat red and blue lines) are shown. Data are representative of three independent replicates. (B) Phase contrast images of NZB11, NZB12, NZB19, and NZB13 serum-differentiated and gCSC cells after 60 h of growth on 96W20IDF ECIS arrays. The dark bands are the interdigitated electrodes. Images acquired at 20× magnification. Data are representative of three independent replicates.

