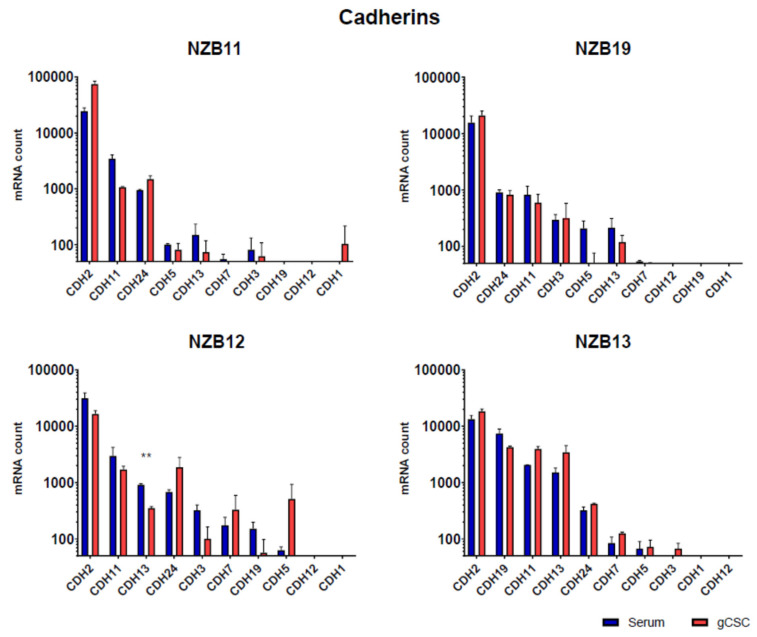
Figure 9.
Cadherin gene expression by glioblastoma cells. NanoStringTM analysis of absolute mRNA counts in NZB11, NZB19, NZB12, and NZB13 serum-derived and gCSC GBM lines. The results of two independent experiments are shown. Unpaired students t-test analysis was carried out comparing the serum vs gCSC mRNA count for each gene where p-value ≤ 0.05 (*) and 0.01 (**).

