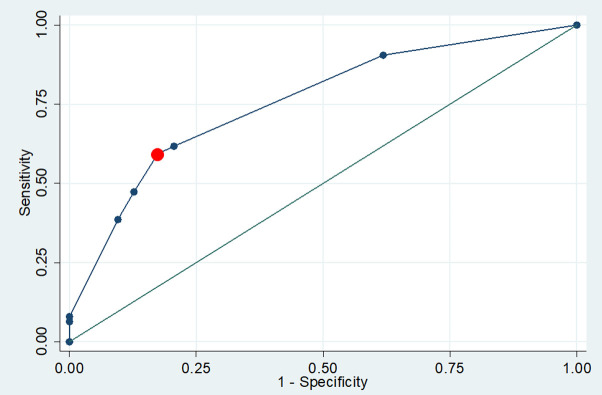
Fig 1. ROC curves–plot of sensitivity versus 1-specificity values for the model: Bilateral CTS score = 0.1 + (1.4 x thenar muscle weakness) + (1.9 x bilateral symptoms) + (0.9 x AGE ≥ 45 yrs).
Scoring: thenar muscle weakness: no = 0, yes = 1; Bilateral symptoms: no = 0, yes = 1; and age ≥45 years: no = 0, yes = 1. The best cutoff score was 2.0.

