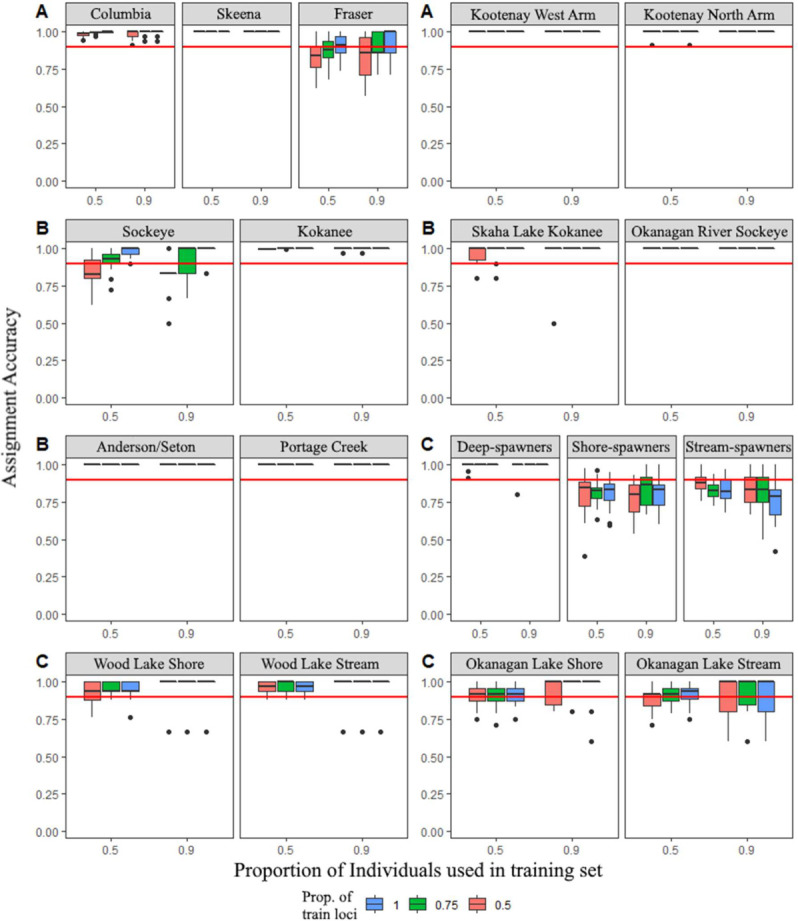
Fig 4. Assignment accuracies estimated using the support vector machine algorithm with Monte-Carlo cross-validation implemented in assignPOP [50].

Sampling of subsets of high θ loci (all loci, blue; top 75%, green; top 50%, orange) are crossed by two levels of training individuals (50%, 90%). Outliers are shown as black circles. The horizontal red line indicates 90% assignment rate. Results grouped by: A: geographic basin, B: migratory form, C: reproductive ecotype.
