Figure 3.
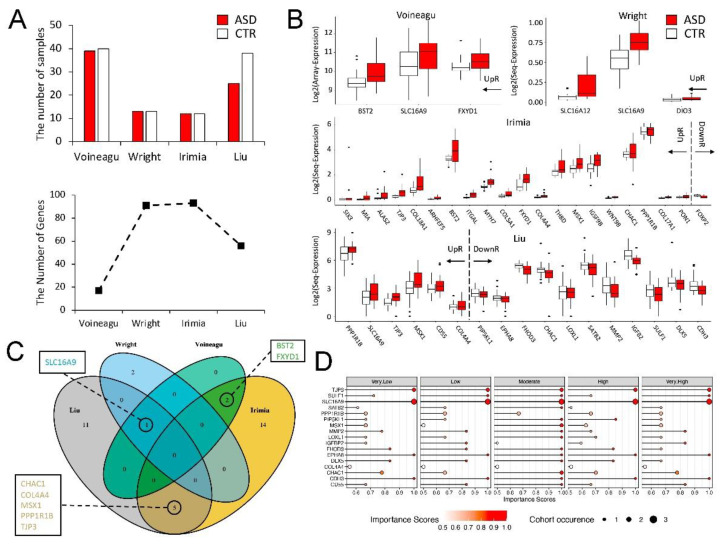
Multiple DEGs in the hippocampi of SD mice are identified as ASD risk genes in four published studies. (A) Top panel bar plot shows the number of ASD and CTR samples in each of the four published cohorts; bottom panel line plot shows the number of mouse-model-identified DEGs that also measured the expression in the cohort. (B) Boxplots show the expression values of overlapped DEGs between mouse models and each cohort (mice-cohort DEGs). There are 3, 3, 21, and 17 SD mice DEGs that are also differentially expressed in the cohort data of Voineagu et al., Wright et al., Irimia et al., and Liu et al., respectively. The genes in the boxplot are ordered by the Log2FC values. (C) Venn diagram shows the overlapping genes between mouse-cohort DEGs. We highlight that SLC16A9 is identified in three cohorts, and that CHAC1, COL4A4, MSX1, PPP1R1B, TJP3, BST2, FXYD1 are identified in two cohorts. (D) Dot plots show the importance score of genes for each ADI-R class in the data of Liu et al. The importance scores are calculated from the learning vector quantization model and are characterized as: Very Low, Low, Moderate, High, Very High, each corresponding to the low, moderate2, moderate1, high2, and high1 ADI-R classes in the original paper, respectively. The larger the importance score, the more the importance of the gene to predicting the ADI-R class. The size of the dot represents the occurrence of the gene in different cohorts.

