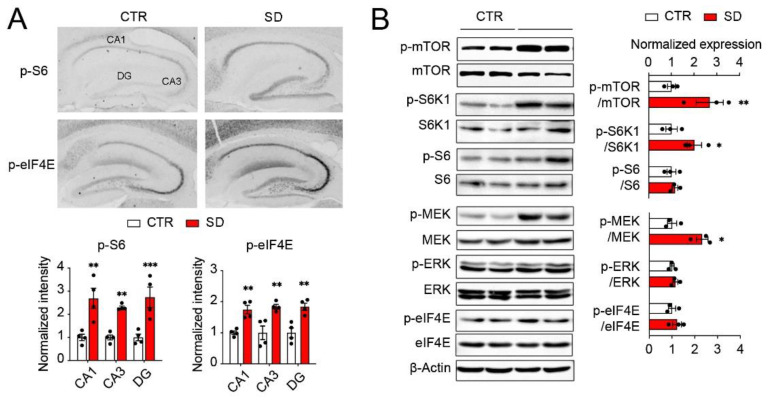
Figure 4.
Hyperactivation of mTOR and ERK MAPK pathways in the hippocampi of SD mice. (A) Representative microscopic images of the sagittal hippocampus sections immunostained for p-S6 and p-eIF4E in the CTR and SD mice. Quantitation of staining intensities in hippocampal CA1, CA3, and DG areas are shown below. Note significant increases in the p-S6 and p-eIF4E levels in the hippocampi of SD mice. Data are displayed as individual values and mean ± SEM. n = 4 in CTR and SD. *** p < 0.001; ** p < 0.01 vs. CTR. (B) Western blots indicate upregulation of mTOR/S6K1/S6 and MEK/ERK/eIF4E kinase activities in the forebrains of SD mice compared with CTR mice. Quantitative analysis is shown to the right. Data are displayed as individual values and mean ± SEM. n = 3 in CTR and SD. ** p < 0.01; * p < 0.05 vs. CTR.

