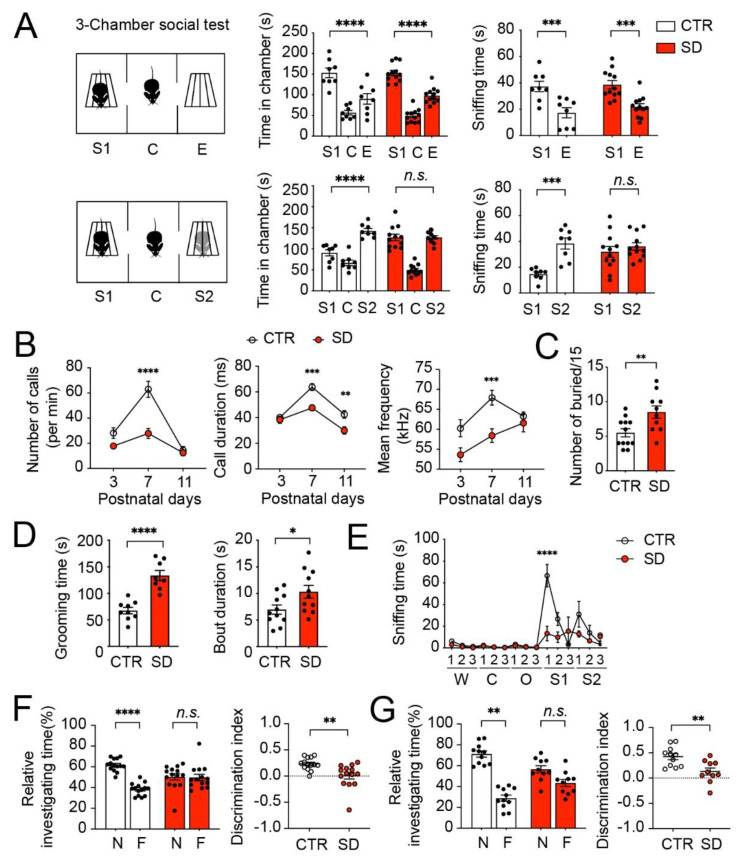
Figure 6.
Autistic-like behavioral changes in SD mice. (A) Three-chamber test for mouse sociability. Left: a schematic diagram. S1: stranger 1; C: center; E: empty; S2: stranger 2. Right: bar graphs indicating time spent in individual chambers and time spent sniffing wire cages during the three-chamber test. Note that both CTR and SD mice spent longer times in the S1 chamber and sniffing the S1 cage, compared with in the E chamber and sniffing the E cage. CTR mice spent longer times in the S2 chamber and sniffing the S2 cage, compared with in the S1 chamber and sniffing the S1 cage. In contrast, SD mice spent similar times in the S1 and S2 chamber and sniffing the S1 and S2 cage. Data are displayed as individual values and mean ± SEM. *** p < 0.001; **** p < 0.0001; n.s., not significant. Data are displayed as individual values and mean ± SEM. n = 8 in CTR and n = 12 in SD. (B) Ultrasonic vocalization tests at Postnatal Day (P) 3, 7, and 11. Note that SD pups exhibited a reduced number of calls, call durations, and call frequencies at P7 compared with the CTR pups. Data are displayed as mean ± SEM ** p < 0.01; *** p < 0.001; **** p < 0.0001 vs. CTR; n = 5–6 for P3 and P11 in CTR and SD; n = 8-9 for P7 in CTR and SD. (C) A bar graph indicates the numbers of marbles buried in the marble burying test. n = 12 in CTR and n = 10 in SD. Data are displayed as individual values and mean ± SEM. ** p < 0.01. (D) Spontaneous self-grooming test. Note that SD (n = 8) mice displayed increased grooming time and duration of bouts as compared with WT (n = 9) mice. * p <0.05; **** p < 0.0001 vs. CTR (E) Olfactory habituation test. W: water; C: cinnamon; O: food (butter); S1: social odor 1 (dirty cage swab1); S2: social odor 2 (dirty cage swab2). Note that time spent sniffing the social odor was markedly reduced, whereas time sniffing nonsocial odors was not changed in the SD mice compared with the CTR mice. **** p < 0.0001 vs. CTR. n = 4 mice in CTR and SD. Data are presented as mean ± SEM. (F) Novel object recognition test. During the training session, mice were exposed to two familiar (F) objects. After 24 h, one F objectwas replaced by a novel (N) object in the testing session. Time animals spent investigating the two objects was measured. The discrimination index was calculated as Timenovel − Timefamiliar/Timenovel + Timefamiliar. CTR (n = 14) mice spent a longer time investigating the N object compared with the F object, whereas the SD (n = 14) mice spent similar time investigating the N and familiar objects. The discrimination index was decreased in the SD mice compared with the CTR mice. ** p < 0.01; **** p < 0.0001 vs. CTR; n.s., not significant. (G) Object location memory test. During the training session, mice were exposed to two identical objects. After 24 h, one object was left at the same familiar (F) location and the other object was moved to a novel(N) location. Time animals spent investigating the two objects was measured. The discrimination index was calculated as Timenovel − Timefamiliar/Timenovel + Timefamiliar. CTR (n = 10) mice spent a longer time investigating the object in the Nlocationas compared with the object in the Flocation, whereas SD (n = 11) mice spent similar time investigating the objects in the Nlocation compared with the object in the Flocation. The discrimination index was decreased in the SD mice compared with the CTR mice. Data are displayed as individual values and mean ± SEM. ** p < 0.01; n.s., not significant.

