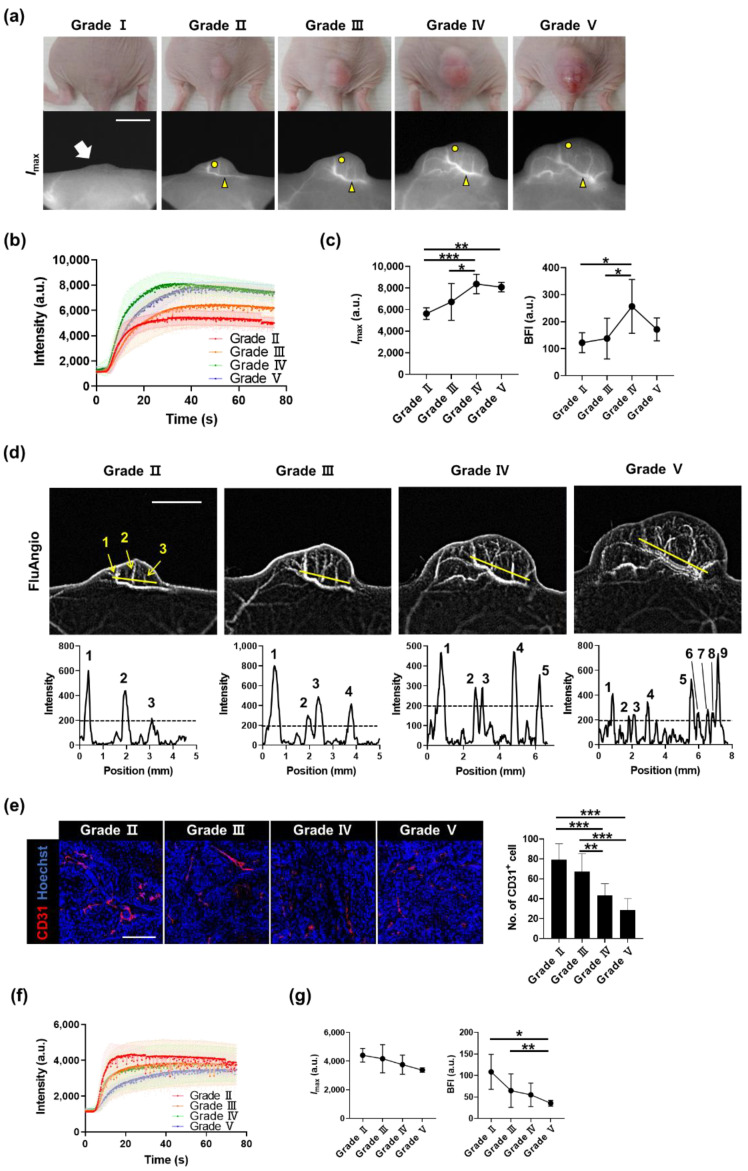
Figure 4.
Monitoring the whole process of tumor angiogenesis and its kinetic analysis. (a) A431 tumors and fluorescence images for each grade were determined based on the tumor size. The white arrow on Grade I indicates the location of the small palpable tumor. In Grades II, III, IV, and V, yellow arrowheads indicate blood vessels analyzed in (b,c), and yellow circles indicate outer areas analyzed in (f,g). Scale bar, 5 mm. (b) ICG dynamics of blood vessels on tumors, marked by yellow arrowheads in (a), from each grade. (c) Changes in Imax and BFI in blood vessels by grade. Data are the mean ± SD for n = 8 mice per grade. *, p < 0.05; **, p < 0.01; ***, p < 0.001 by one-way ANOVA. (d) FluAngio maps presenting tumor vessels on each grade (top). As the size of the tumor increases, the length of the line (yellow) is proportionally increased. It can be seen that the three micro blood vessels clearly visible on the FluAngio map of Grade II can also be identified in the line profile. Scale bar, 5 mm. Line profile graphs of fluorescence intensity above yellow lines on FluAngio maps show the changes in tumor microvessels and an increase in their number as the grade progressed (bottom). (e) Immunostaining of CD31 (red) in outer regions from A431 tumors, marked by yellow circles in (a), on each grade (left), and the number of CD31-positive cells (right). Nuclei are stained in blue with Hoechst 33,342 counterstaining. Data are the mean ± SD for at least two independent fields examined per mouse (n ≥ 3 mice per group). Scale bar, 100 μm. **, p < 0.01; ***, p < 0.001 by one-way ANOVA. (f) ICG dynamics of outer areas on tumors from each grade. (g) Changes in Imax and BFI in outer areas by grade. Data are the mean ± SD for n = 8 mice per grade. *, p < 0.05; **, p < 0.01 by one-way ANOVA.

