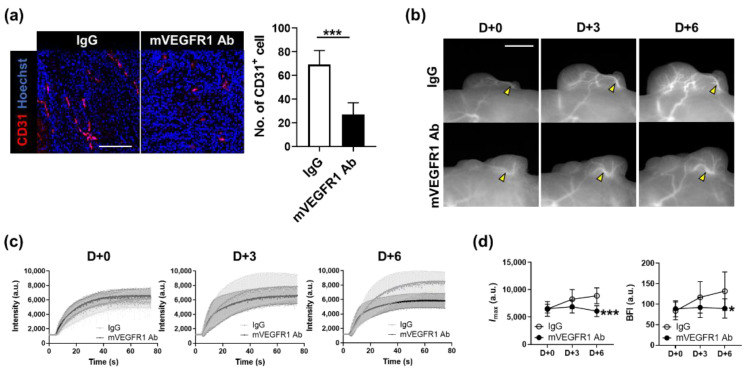
Figure 5.
Effect of mVEGFR1 Ab on the thickness of blood vessels and blood flow through main vessels. (a) Immunostaining of CD31 (red; left) and the number of CD31-positive cells (right) in A431 tumors treated with IgG or mVEGFR1 Ab. Nuclei are stained in blue with Hoechst 33,342 counterstaining. Data are the mean ± SD for at least three independent fields examined per mouse (n ≥ 3 mice per group). Scale bar, 100 μm. ***, p < 0.001 by Student’s t-test. (b) Longitudinal observation of fluorescence images in tumors treated with IgG or mVEGFR1 Ab twice at D+0 and D+3. Yellow arrowheads indicate blood vessels analyzed. Scale bar, 100 μm. (c) ICG dynamics of tumor blood vessels marked by yellow arrowheads in (b), from each day. (d) Changes in Imax and BFI in blood vessels by day. Data are the mean ± SDM for n ≥ 7 mice per group. *, p < 0.05; ***, p < 0.001 by two-way ANOVA.

