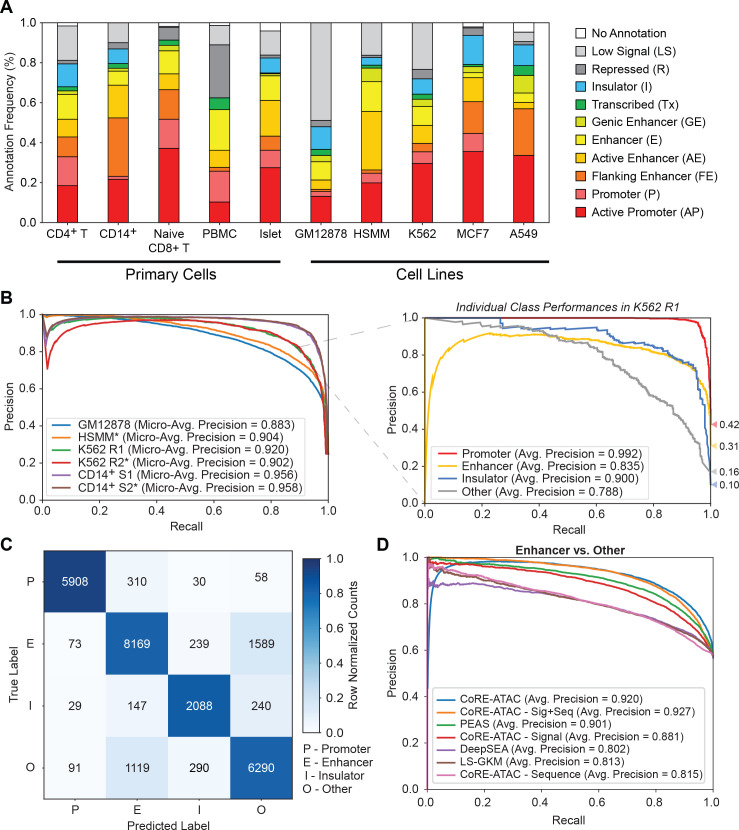
Fig 2. CoRE-ATAC outperforms sequence-based enhancer prediction methods.
CoRE-ATAC predictions were evaluated using held out test data (chromosomes 3 and 11). (A) ChromHMM state distributions for different cell types used in this study. ATAC-seq open chromatin maps correspond to a multitude of cis-RE functional states, corresponding to Active Promoter (AP), Promoter (P), Flanking Enhancer, (FE), Active Enhancer (AE), Enhancer (E), Genic Enhancer (GE), Transcribed (Tx), Insulator (I), Repressed (R) and Low Signal (LS). (B) Micro-average precision values (left) were calculated, summarizing the average precision values for individual class predictions for all cell types used in model training. A breakdown of individual class average precision scores is shown for K562 (right). (C) Combined confusion matrix of model predictions across all cell types used in model training. Note that models are predictive for all class labels: promoters (P), enhancers (E), insulators (I), and other (O). However, mispredictions were more frequently observed between enhancer and other functional classes. (D) Receiver operating characteristic (ROC) curves for different enhancer prediction models: CoRE-ATAC, PEAS, DeepSEA and LS-GKM and CoRE-ATAC’s sequence, signal, and signal+sequence (No PEAS features) models. Models were evaluated for predicting enhancer versus “other” classes for chr3 and chr11 of the GM12878, HSMM, K562, and CD14+ datasets. Note that CoRE-ATAC outperforms alternative methods.

