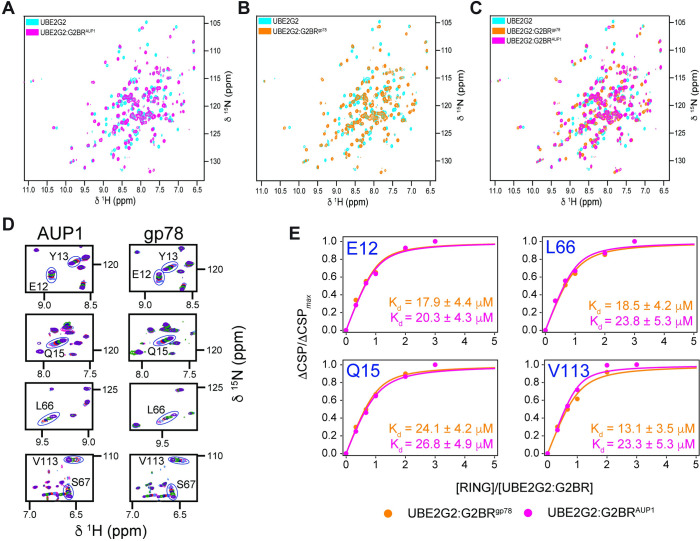
Fig 5. Titration of UBE2G2:G2BR with gp78 RING.
Superposition of 15N-1HN HSQC NMR spectra for apo-UBE2G2 and UBE2G2 bound to G2BRAUP1 (A) or G2BRgp78 (B). Spectra for UBE2G2 (150 μM) bound to G2BR were acquired at a 1:1.1 ratio. (C) Superposition of the spectra for apo-UBE2G2, UBE2G2:G2BRAUP1, and UBE2G2:G2BRgp78, illustrating the equivalence of perturbations between G2BRAUP1 and G2BRgp78. (D) Expansion of overlaid resonances corresponding to UBE2G2 residues showing fast exchange binding kinetics for gp78 RING binding to both UBE2G2:G2BRAUP1 (left panels) and UBE2G2:G2BRgp78 (right panels). Spectra were acquired at ratios of RING to UBE2G2:G2BR of 0, 0.33, 0.67, 1.0, 2.0, and 3.0. (E) Binding curves as a function of [RING]/[UBE2G2:G2BR] ratio and analyses for representative residues E12, Q15, L66, and V113 of UBE2G2:G2BRgp78 (orange) and UBE2G2:G2BRAUP1 (magenta) UBE2G2:G2BR binding to gp78 RING. Errors are reported from the regression analysis of the data in S1 Table (B, D). G2BR, UBE2G2 Binding Region; NMR, nuclear magnetic resonance.

