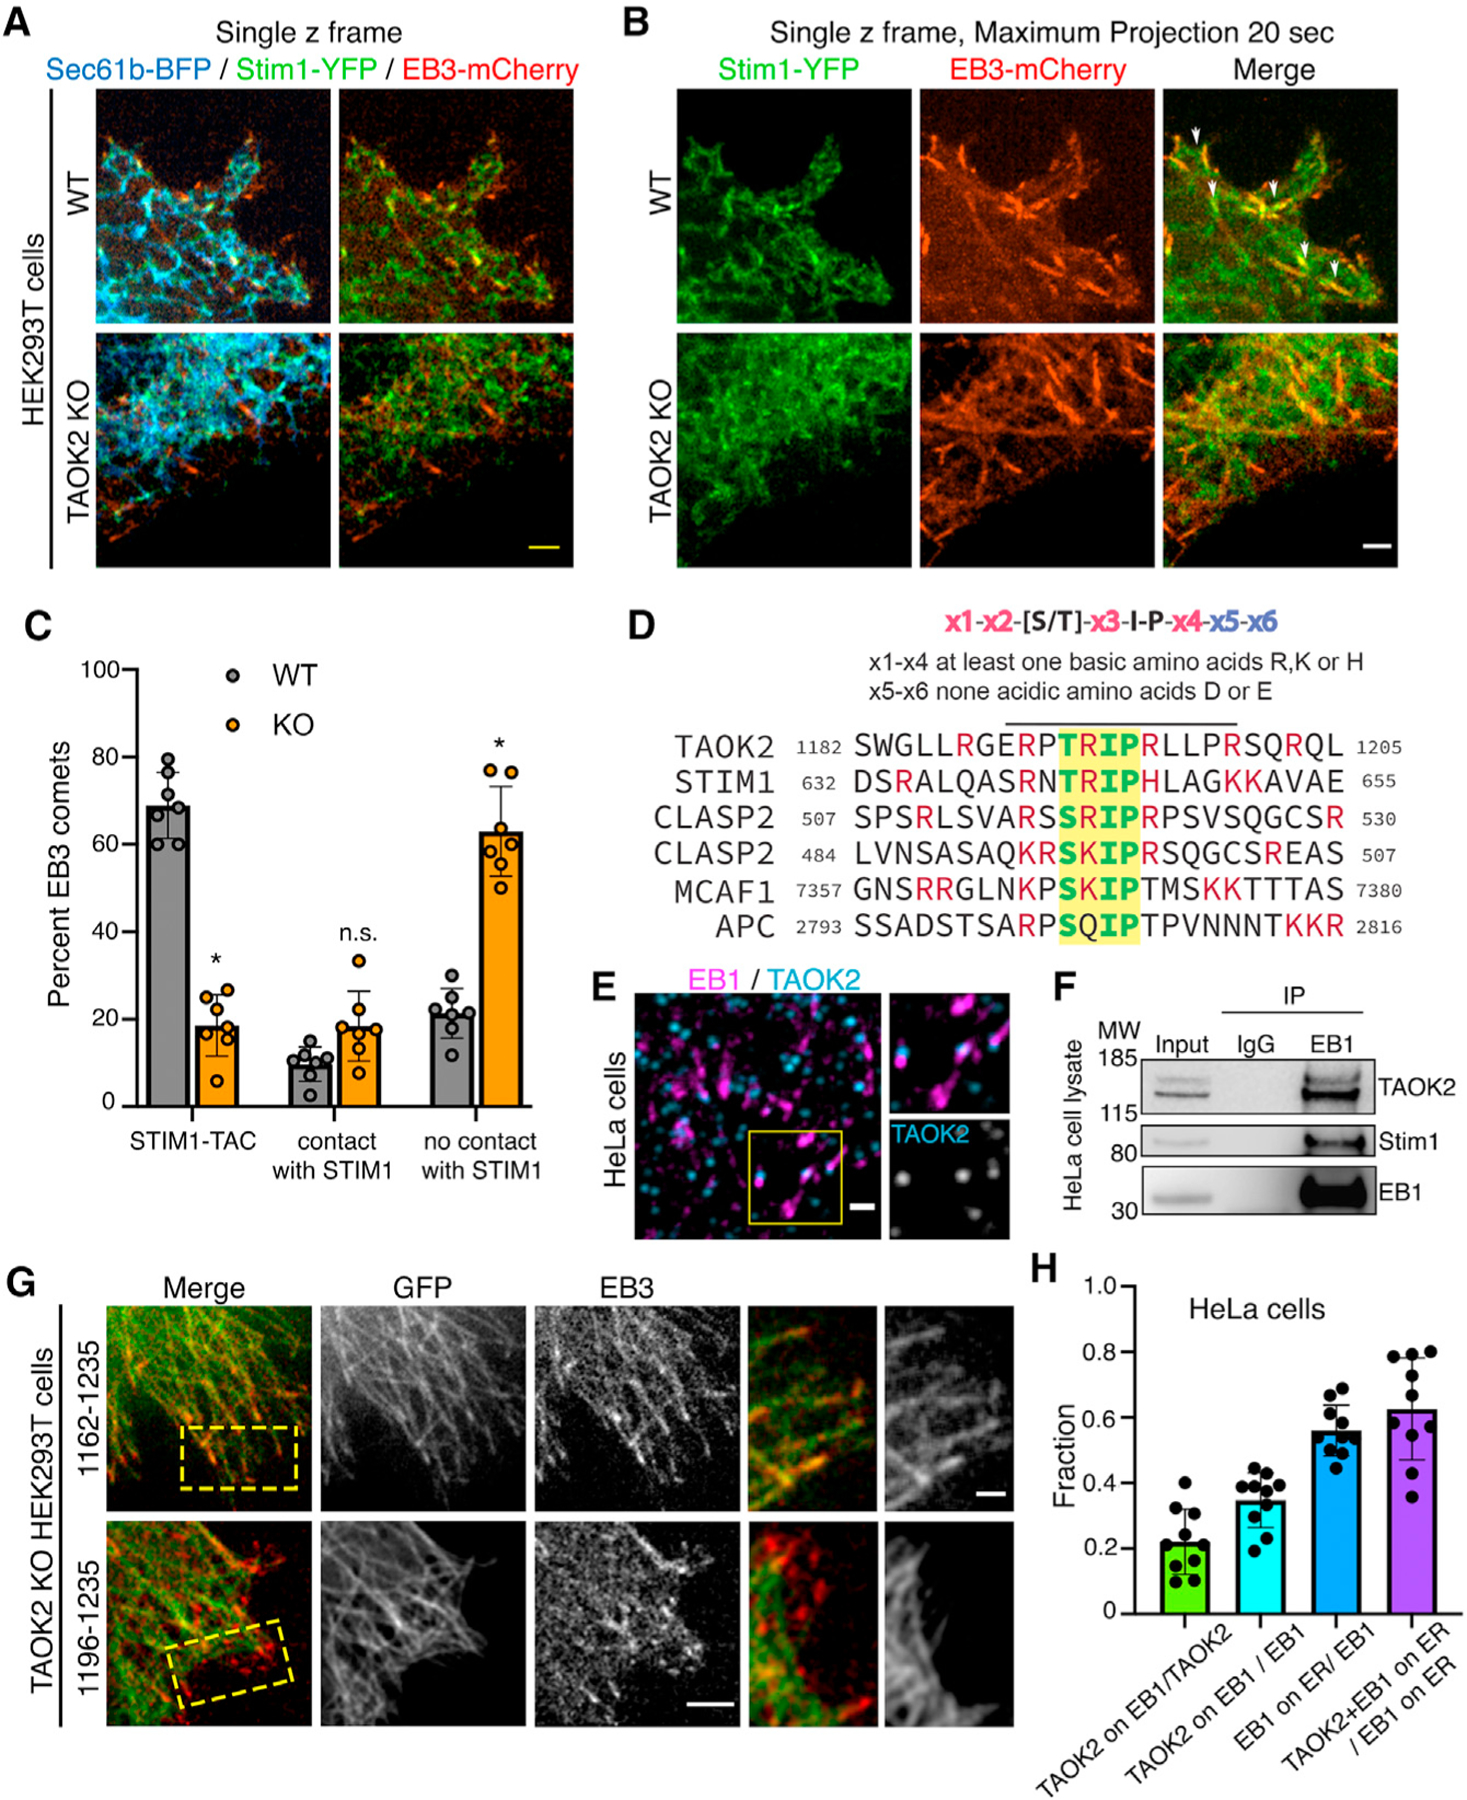
Figure 5. TAOK2 regulates ER TAC movement and interacts with EB1 via SxIP motif.

(A) Single z-frame confocal images of WT and TAOK2 KO cells expressing ER marker Sec61-BFP (blue), STIM1-YFP (green) and EB3-mcherry (red). Scale bar: 3 μm.
(B) Maximum projection of single z frames shown in (A) over a period of 20 s to visualize movement and paths of EB3 and STIM1 over time in WT and TAOK2 KO cells. STIM1-YFP (green) and EB3-mcherry (red). Scale bar: 3 μm.
(C) EB3 comets were classified as (1) comets interacting with STIM1/ER and performing TAC, (2) comets interacting with STIM1 transiently but not performing TAC, and (3) comets not contacting STIM1/ER. Values indicate mean ± SEM; n = 7 cells from 3 experiments; two-way ANOVA. *p < 0.05.
(D) Schematic depicts the SxIP motif of MT plus tip-interacting proteins that associate with EB proteins.
(E) HeLa cells immunostained for EB1 (magenta) and TAOK2 (blue). Scale bar: 1 μm.
(F) Western blot (n = 3) shows coimmunoprecipitation of TAOK2 and STIM1 with EB1 using anti-EB1 antibodies; 1% input is shown for comparison.
(G) TAOK2 KO cells transfected with EB3-mcherry (red) along with GFP (1,196–1,235) or GFP (1,162–1,235) containing the TRIP (SxIP) motif. Scale bar: 3 μm.
(H) Bar graph represents fractions of EB1-positive TAOK2 punctae to total TAOK2 punctae, number of TAOK2-positive EB1 punctae compared to total EB1 punctae, number of EB1 puncta on ER compared with total EB1 punctae, and number of TAOK2-positive EB1 punctae on ER compared with the total number of EB1s on the ER. Values indicate mean ± SEM; n = 10 cells from 3 experiments. See also Figure S4.
