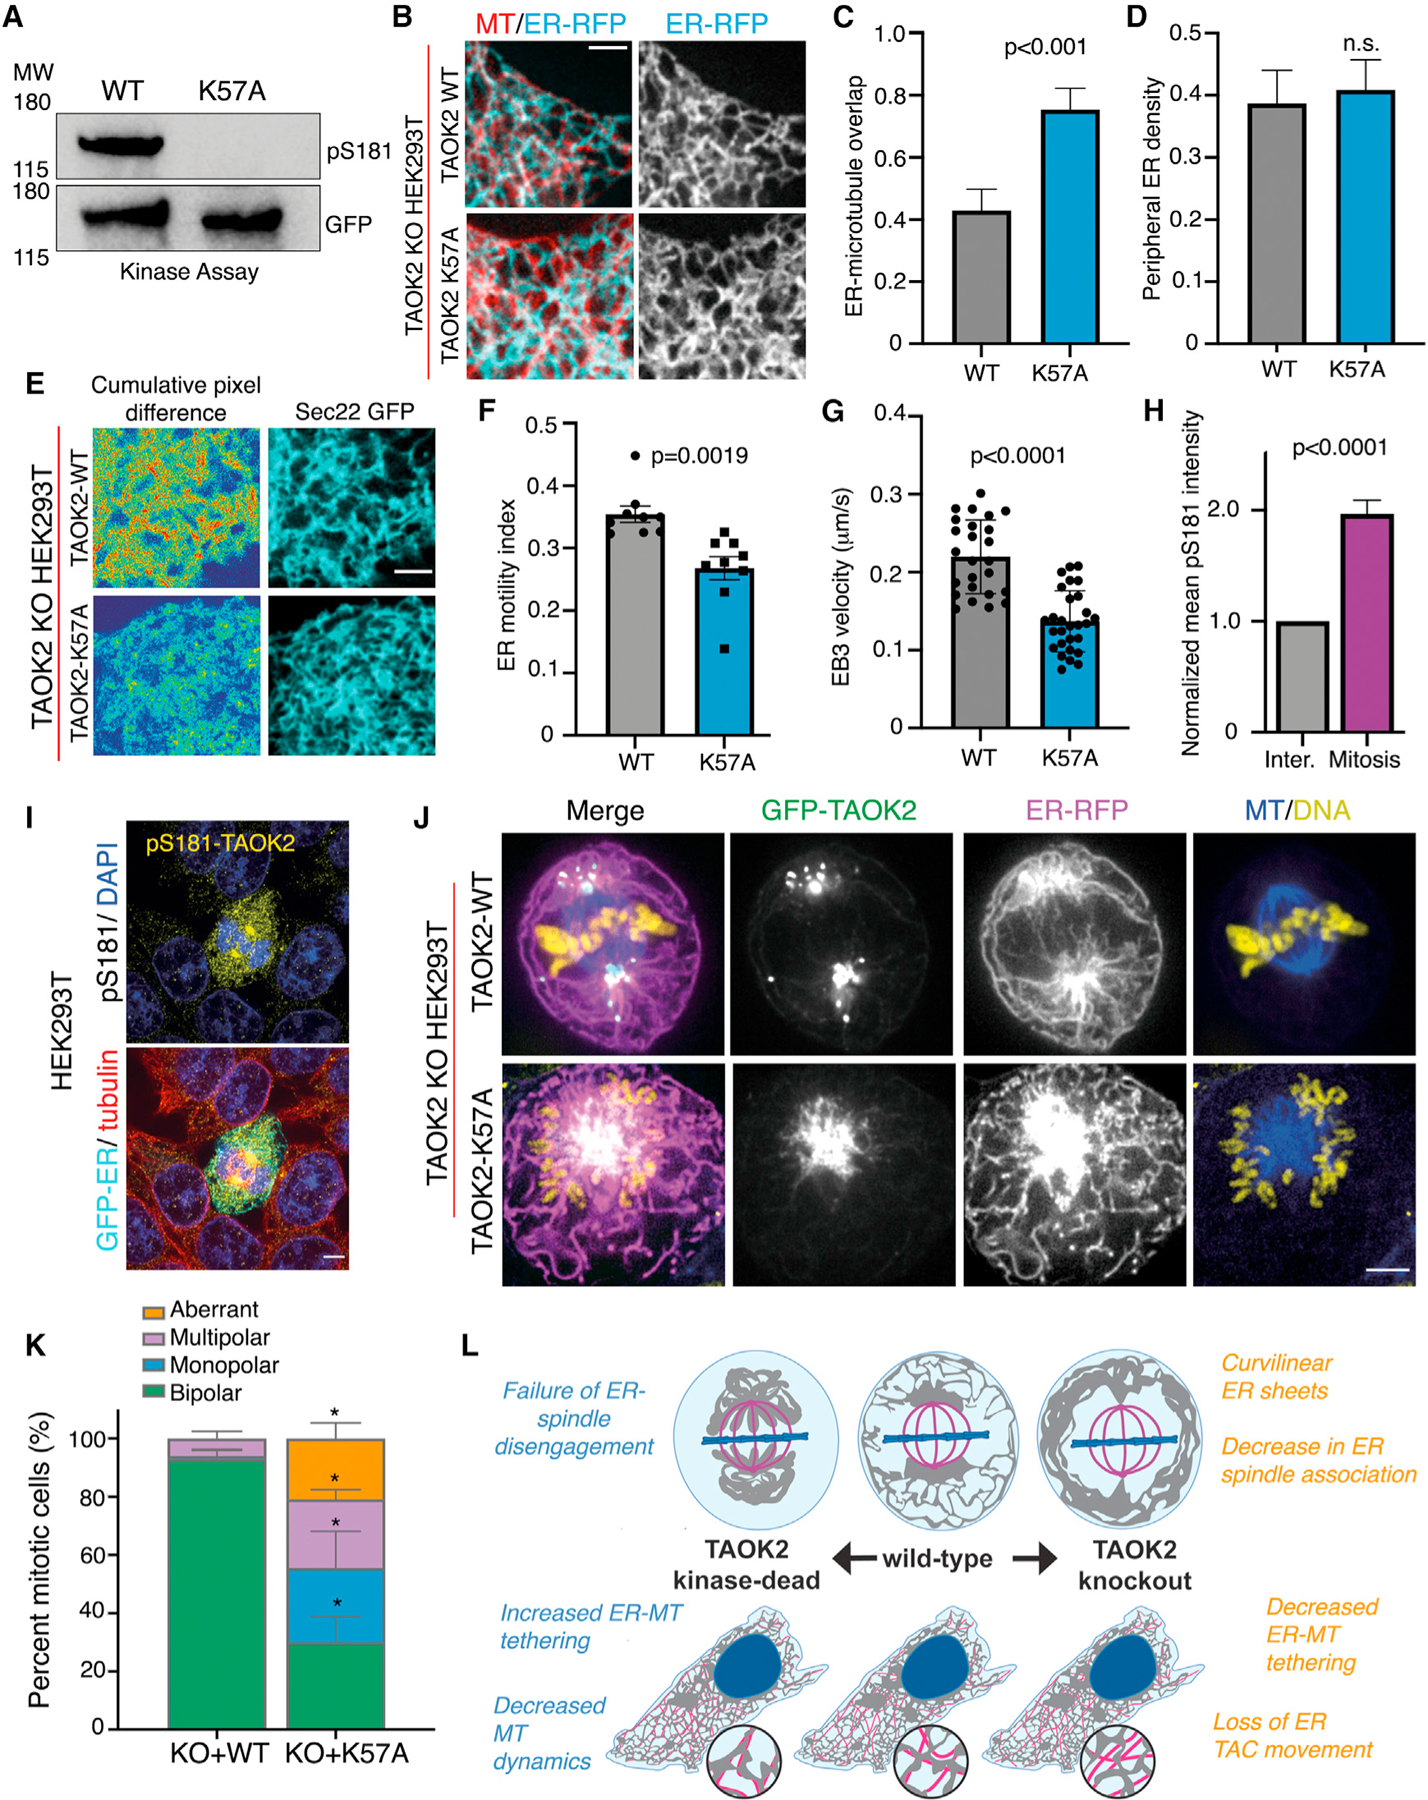
Figure 7. ER-MT tethering is regulated by catalytic activity of TAOK2.

(A) Western blot probed with phospho-S181 antibody to measure kinase activity of GFP-TAOK2 WT and GFP-TAOK2 K57A.
(B) TAOK2 KO cells expressing TAOK2-WT or TAOK2-K57A along with ER-mRFP (cyan) and live-stained with MT dye (red). Scale bar: 3 μm.
(C) Ratio of peripheral ER in contact with MT in a 100-μm2 region in cell periphery is plotted for TAOK2 KO cells expressing either TAOK2-WT or TAOK2-K57A. Values indicate mean ± SEM; n = 6 from 3 experiments; t test with Welch’s correction.
(D) ER density is calculated by measuring the fraction of ER area in a 100-μm2 region in the cell periphery. Values indicate mean ± SEM; n = 6 from 3 experiments; t test with Welch’s correction.
(E) Confocal images of peripheral ER in TAOK2 KO cells expressing TAOK2 WT or TAOK2 K57A along with EGFP-Sec22b at a single time point (left column). Sum slice projection of cumulative pixel difference in successive frames over 30 s; images were acquired every 3 s are shown. Fluorescence intensity is pseudo-colored, red regions representing increased ER motility. Scale bar: 3 μm.
(F) ER-motility index is plotted; error bars indicate SEM; n = 9 cells from 3 experiments; two-tailed t test.
(G) EB3 velocity is plotted; values indicate mean ± SEM; n = 5 cells from 3 experiments with 5 comets/cell; two-tailed t test.
(H) Normalized average intensity of phospho-S181 in mitotic cells is plotted. Error bars indicate SEM, n = 10 cells from 3 experiments; t test with Welch correction.
(I) Confocal images of mitotic and interphase cells stained with phospho-S181 and tubulin antibodies.
(J) Confocal images of TAOK2 KO mitotic cells expressing either GFP-TAOK2 WT or GFP-TAOK2 K57A (green) along with ER-mRFP (magenta) and stained with DNA (yellow) and MT dyes (blue). Scale bar: 5 μm.
(K) Mitotic defects in TAOK2 KO cells expressing either GFP-TAOK2 WT or GFP-TAOK2 K57A. Values indicate mean ± SEM; n = 85 cells from 3 experiments. *p< 0.05.
(L) Representation of pleiotropic function of TAOK2 in maintaining ER-MT tethering, MT dynamics, and ER remodeling during interphase and mitosis. See also Figure S5.
