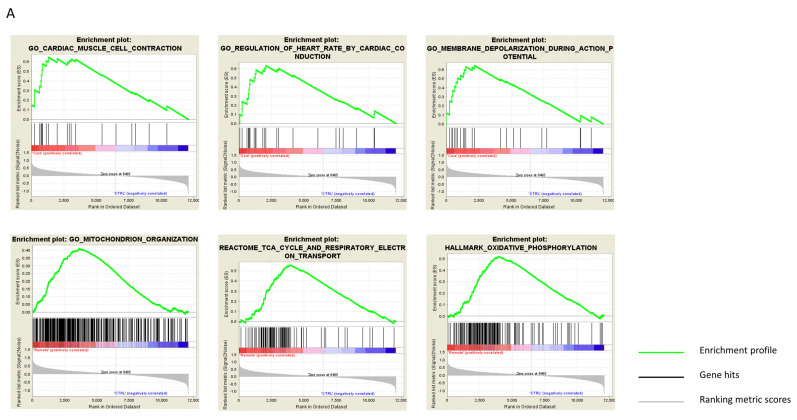
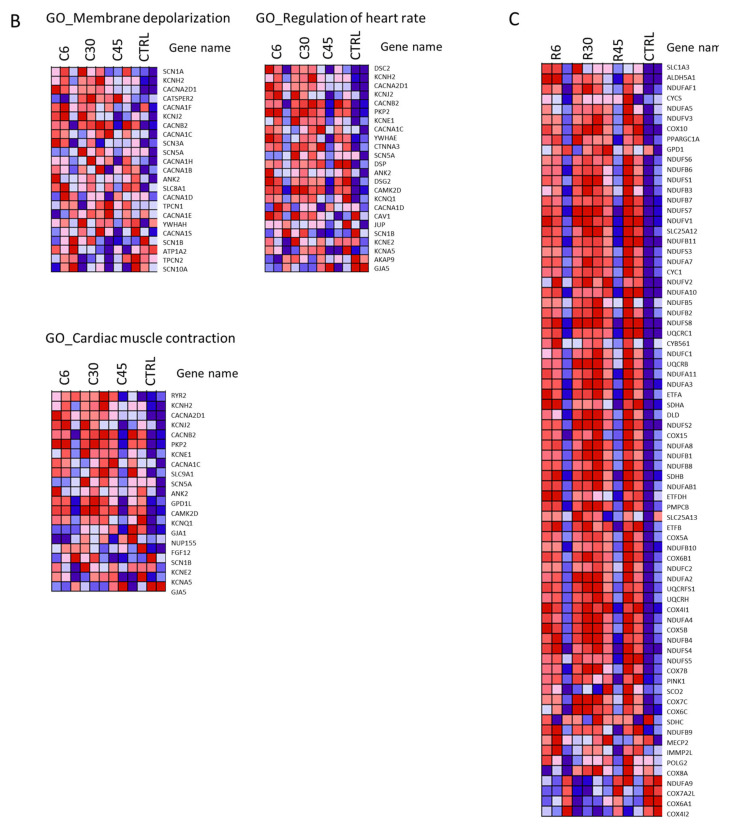
Figure 4.
Enrichment and overlap analyses and heatmap clustering. (A) Results of the enrichment and overlap analyses. Upper panels: infarct core region. Lower panels: remote myocardium region. The enrichment score (ES) reflects the degree to which a gene set is over-represented at the top or bottom of a ranked list of genes, with a positive or negative ES indicating gene set enrichment at the top or bottom of the list, respectively. ES is calculated by walking down the ranked list of genes, increasing a running-sum statistic when a gene is in the gene set and decreasing it when it is absent. The magnitude of the increment depends on the correlation of the gene with the phenotype. The ES is the maximum deviation from zero encountered in walking the list. (B,C) Heatmap clustering. (B) The clustered genes in the leading-edge subsets in the upper panels in (A) (core region). (C) The clustered genes in the leading-edge subsets in the lower panels in (a) (remote region). Expression values are represented by colors, with red, pink, light blue, and dark blue indicating high, moderate, low, and lowest expression, respectively.


