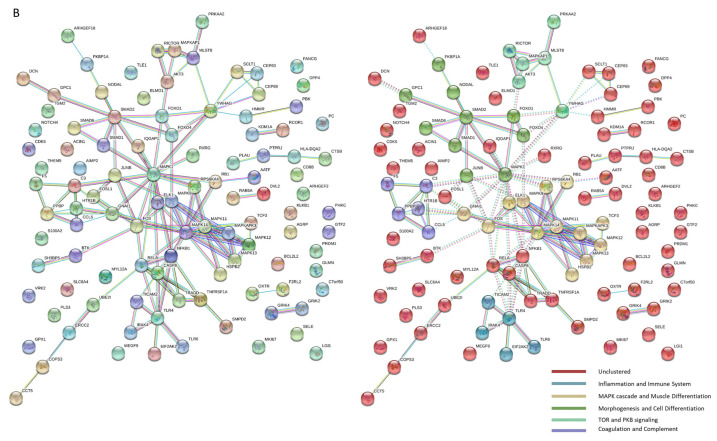
Figure 5.
Protein–protein interaction network analysis. (A) Venn diagram depicting the common enriched pathways between the three different time points. (B) Network analysis using STRING software, including the 105 protein candidates identified by artificial intelligence analysis techniques. Left: the cloud of interactions at 0.9 evidence. Right: the same interactions clustered by k-means for vector quantization at K = 6. Number of nodes: 105; number of edges: 128; average node degree: 2.44; average local clustering coefficient: 0.469; expected number of edges: 62; PPI enrichment p-value: 1.32 × 10⁻⁷.


