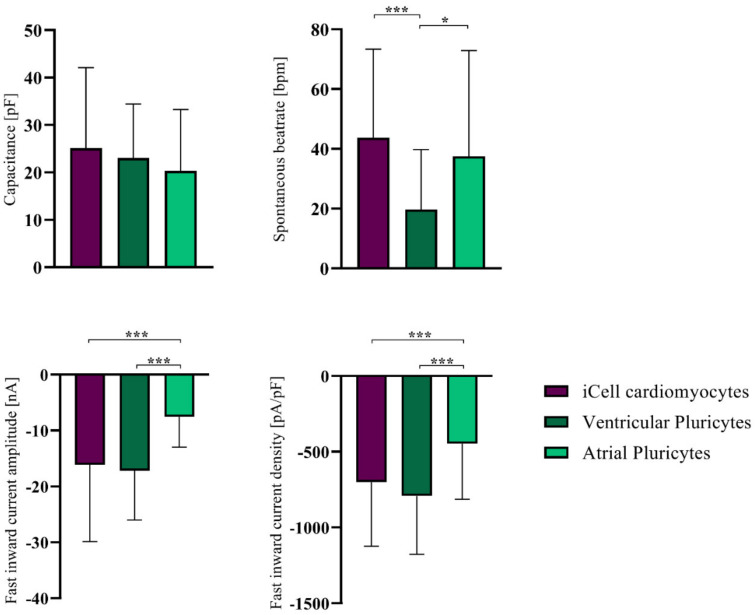
Figure 2.
Comparison of electrophysiological parameters between hiPSC-CM groups. Data are shown as mean ± SD. Students t-test was used to compare groups. *, *** indicate p < 0.05, and p < 0.001, respectively. The numbers of total recordings used to calculate means are listed in Table 2.

