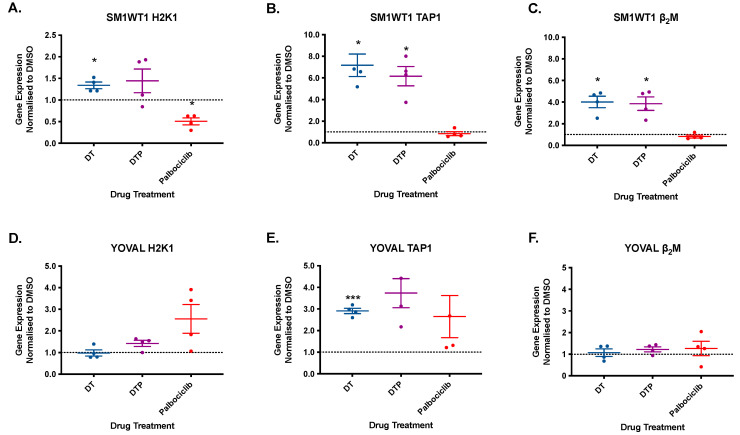
Figure 6.
SM1WT1 and YOVAL1.1 gene expression of H2K1, TAP1 and β2M. SM1WT1 and YOVAL1.1 treated with control (DMSO), dabrafenib-trametinib (DT), dabrafenib-trametinib-palbociclib (DTP), and palbociclib monotherapy. Samples analyzed using real time PCR for H2K1 (A,D), TAP1 (B,E), and β2M (C,F). Mean ± SEM, n = 4. Gene expression normalized to DMSO control. Statistical significance was determined using one way ANOVA * p < 0.05, *** p < 0.001.

