Figure 2.
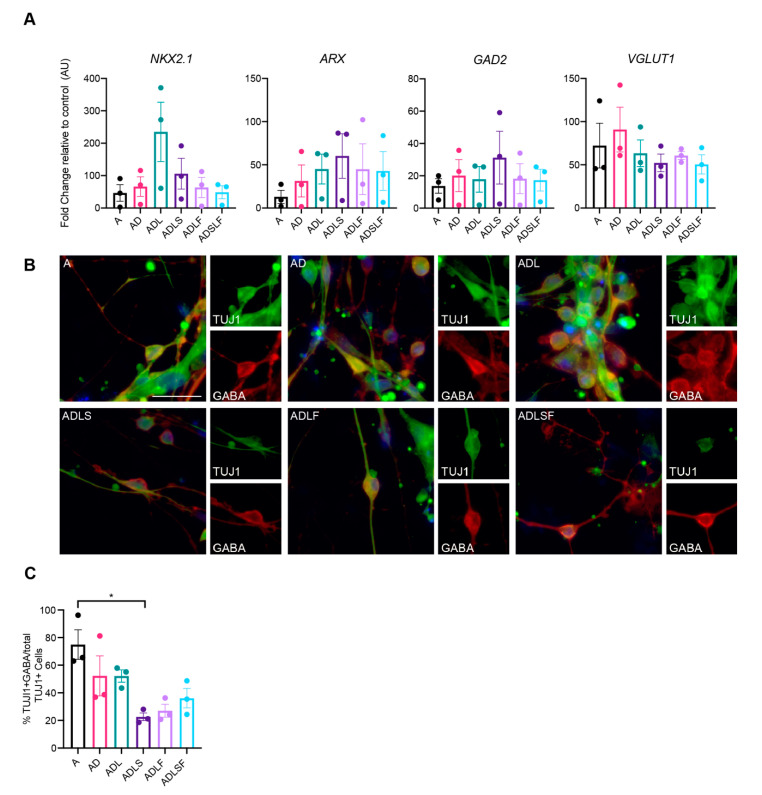
Quantification of GABAergic cells across different viral conditions at day 25. (A) RT-qPCR of neuronal lineage markers (n = 3). (B) Immunocytochemistry of reprogrammed GABAergic neurons. (C) Quantification of TuJ1 and GABA double positive cells (n = 3) * p < 0.05. Scale bar represents 50 µm.

