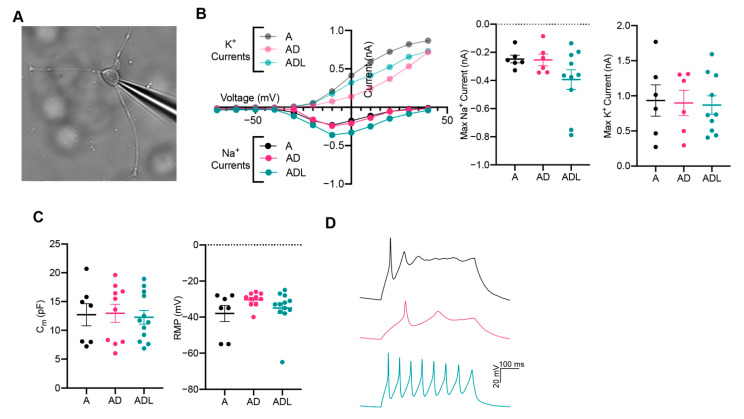
Figure 4.
Functional analysis of induced neurons converted with A, AD or ADL at day 25. (A) Representative image of iN in whole-cell patch-clamp configuration. (B) Inward Na+ and outward K+ currents plotted against stepwise voltage induction at day 25: A (black), AD (magenta/pink) and ADL (green/light green); with each dot representing a mean value (n = 5 for A, n = 6 for AD and n = 10 for ADL). (C) Intrinsic membrane properties, capacitance (left) and resting membrane potential (RMP) (right). (D) Representative trace of immature evoked action potentials triggered by rheobase current injection steps: A (black), AD (magenta) and ADL (green).

