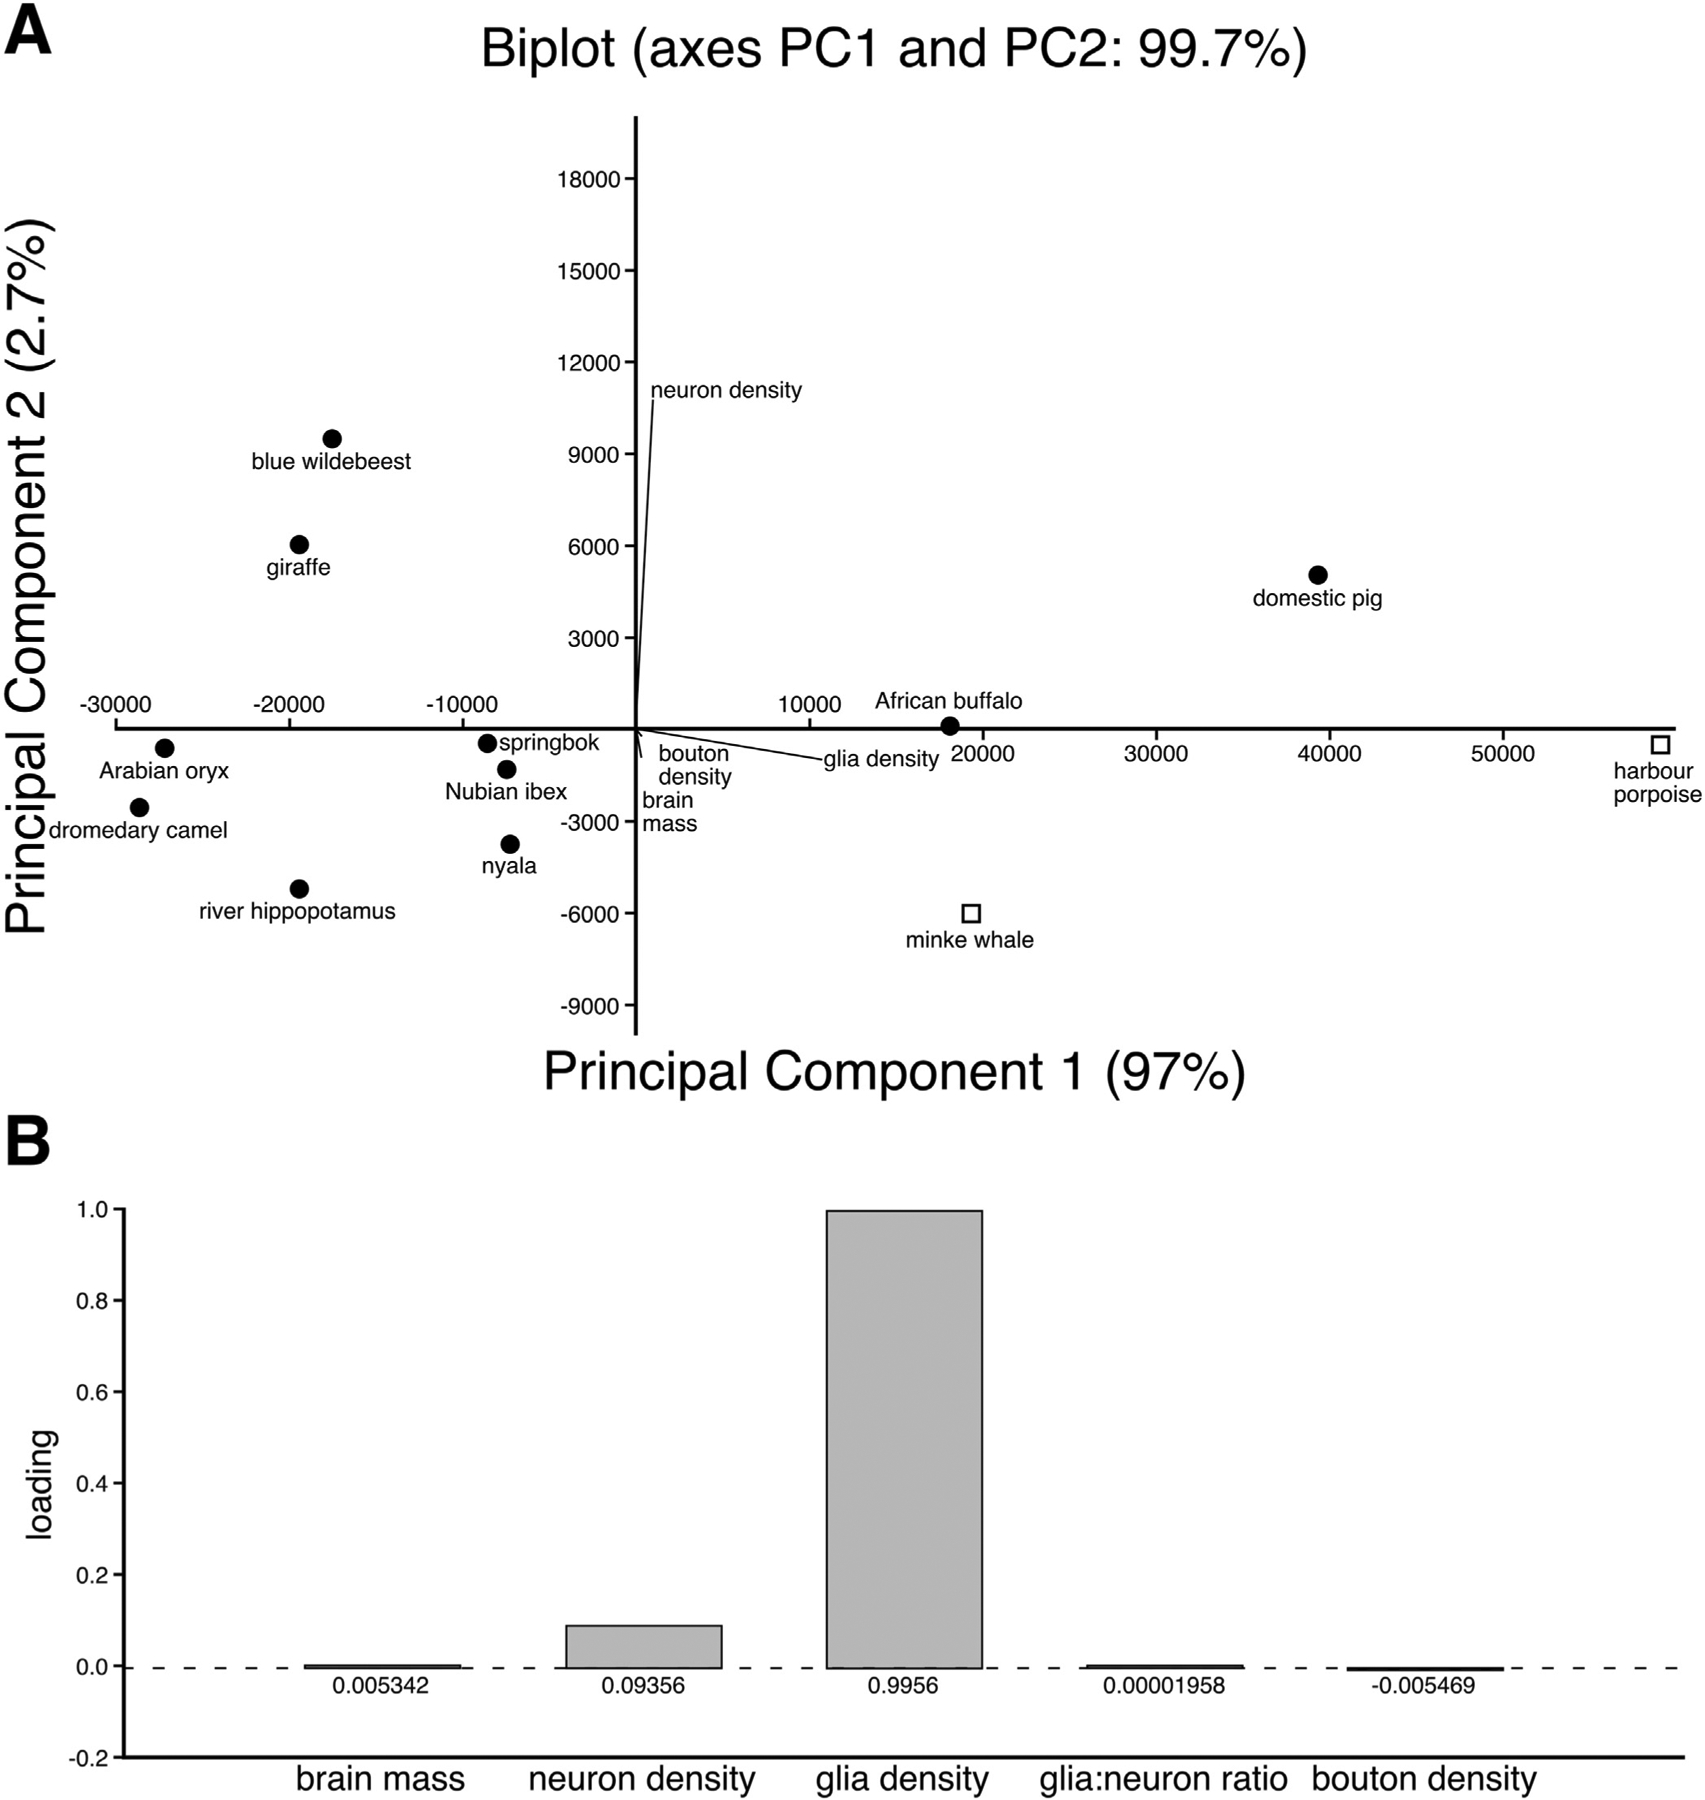
Fig. 9.

(A) Principal component analysis biplot showing the individual scatter and the variables that contributed towards differentiating the species. Principal component 1 explained 97% of the total variance while principle component 2 explained 2.7% of the total variance. The length and direction of the biplot lines determine the strength and the contribution of each of the variables to the respective principal components. For example glia density has a strong and positive influence on PC1, but a negative and weak influence on PC2. Neuron density has a positive and strong influence on PC2, but a weakly positive potentially negligible influence on PC2. Bouton density and brain mass only present with small negative associations with PC2. (B) The accompanying Factor Loadings plot showing the individual loading of the five variables on Principal component 1. Note that glial density was the most useful variable in describing the variance in Principal component 1 (i.e., factor loading ≥ 0.70).
