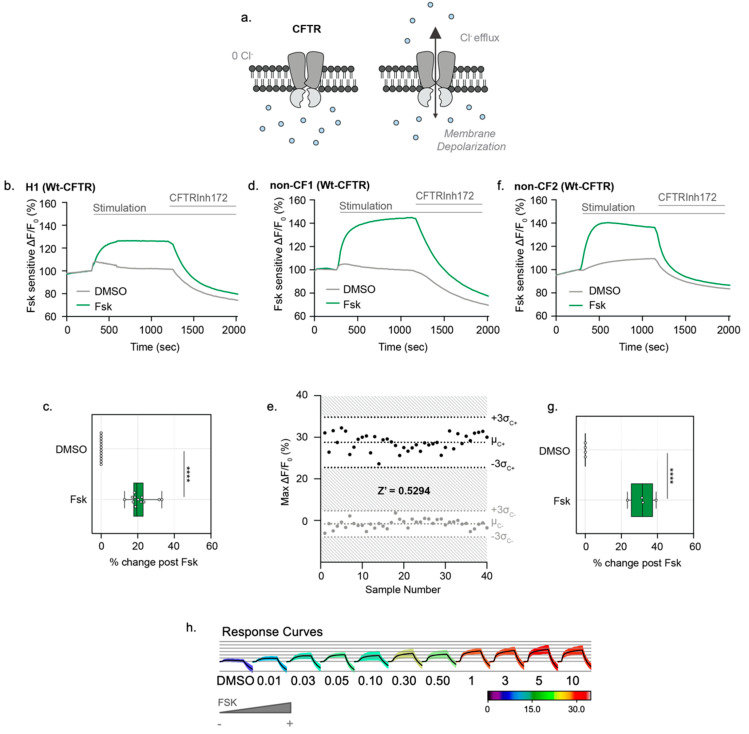
Figure 3.
Opened iPSC-HIOs enable direct measurements of Wt-CFTR function in a high-throughput format. (a) Schematic depicting the Apical Chloride Conductance (ACC) assay. Opened iPSC-HIOs are placed in a zero-chloride extracellular buffer. Fsk stimulates CFTR-mediated chloride efflux, leading to an increase in membrane potential and an increase in fluorescence. The signal is terminated with acute treatment of CFTRInh172. (b) Representative trace and (c) Box and whisker plot of Wt-CFTR function measured in H1 Embryonic Stem Cell (ESC)-derive organoids treated with Fsk or DMSO control (**** p < 0.0001, n > 3 biological replicates, n > 3 technical replicates). Box plot depicts the median value and bounds depict IQR ranges with the whiskers defining the minima and maxima values. There are occasional minor deflections with DMSO addition, which we interpret as an artifact. This nonspecific response was subtracted during quantification shown in the bars and whiskers. (d) Representative trace of WT-CFTR function measured in opened non-CF organoids stimulated with Fsk (10 µM). CFTR response was terminated with CFTRinh172 (10 µM). (e) Bland–Altman plot depicting reproducibility of stimulated CFTR response. Black points measure the maximum change in fluorescence changes with acute Fsk stimulation in comparison to grey points representing DMSO control. (f) Representative traces and (g) box and whisker plot of Wt-CFTR function measured in non-CF2 iPSC-derived opened organoids treated with Fsk or DMSO control (**** p < 0.0001, n = 4 technical replicates). (h) Response curves of opened non-CF organoids stimulated with increasing concentrations of Fsk.

