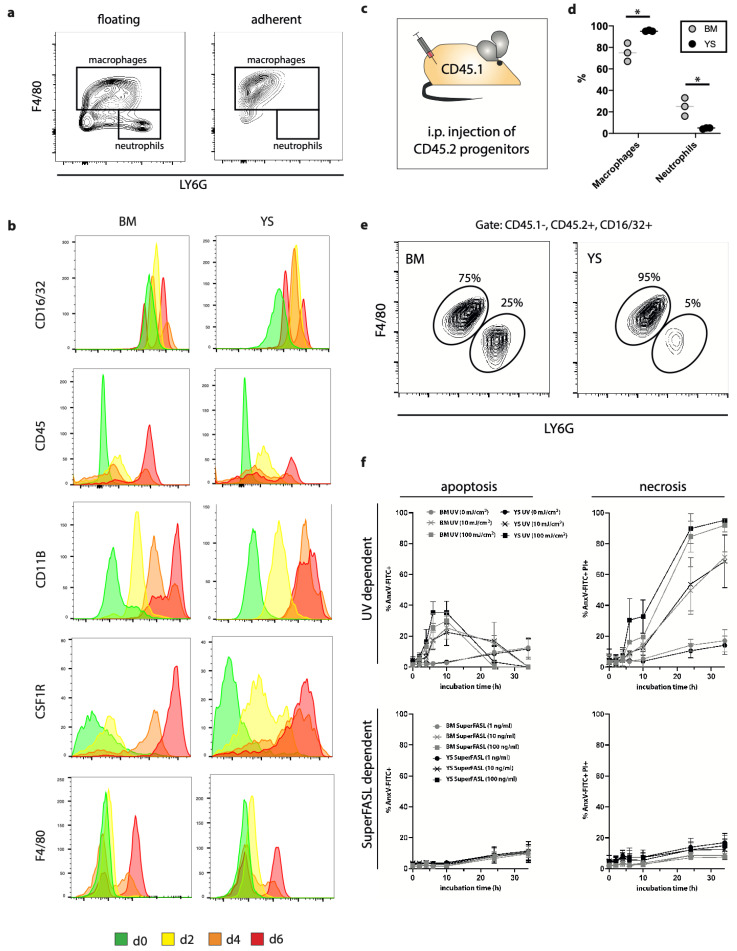
Figure 2.
Expression profile and survival of Hoxb8 macrophages. (a) Flow cytometry analysis of floating or adherent differentiated (day 5) Hoxb8 BM cells labeled with indicated antibodies (representative plot, n = 3). (b) Flow cytometry analyses of Hoxb8 progenitors in the process of differentiation towards macrophages (d0 to d6) labeled with indicated antibodies (representative experiment of n = 3). (c) Schematic graph for intraperitoneal Hoxb8 progenitor application. (d–f) Flow cytometry quantification of in vivo differentiated Hoxb8 macrophage and neutrophil populations obtained by peritoneal lavage after one week. Live CD45.1− CD45.2+ CD16/32+ single cells were gated, then macrophages and neutrophils were separated by F4/80 and LY6G intensities. Results are displayed as (d) relative quantities of differentiated cell populations; (e) corresponding contour plots (representative experiment of n = 3). (f) Quantification of UV and SuperFASL dependent apoptosis and necrosis in differentiated Hoxb8 macrophages. n = 3. Unpaired, two-tailed t-test. (*) p < 0.05.

