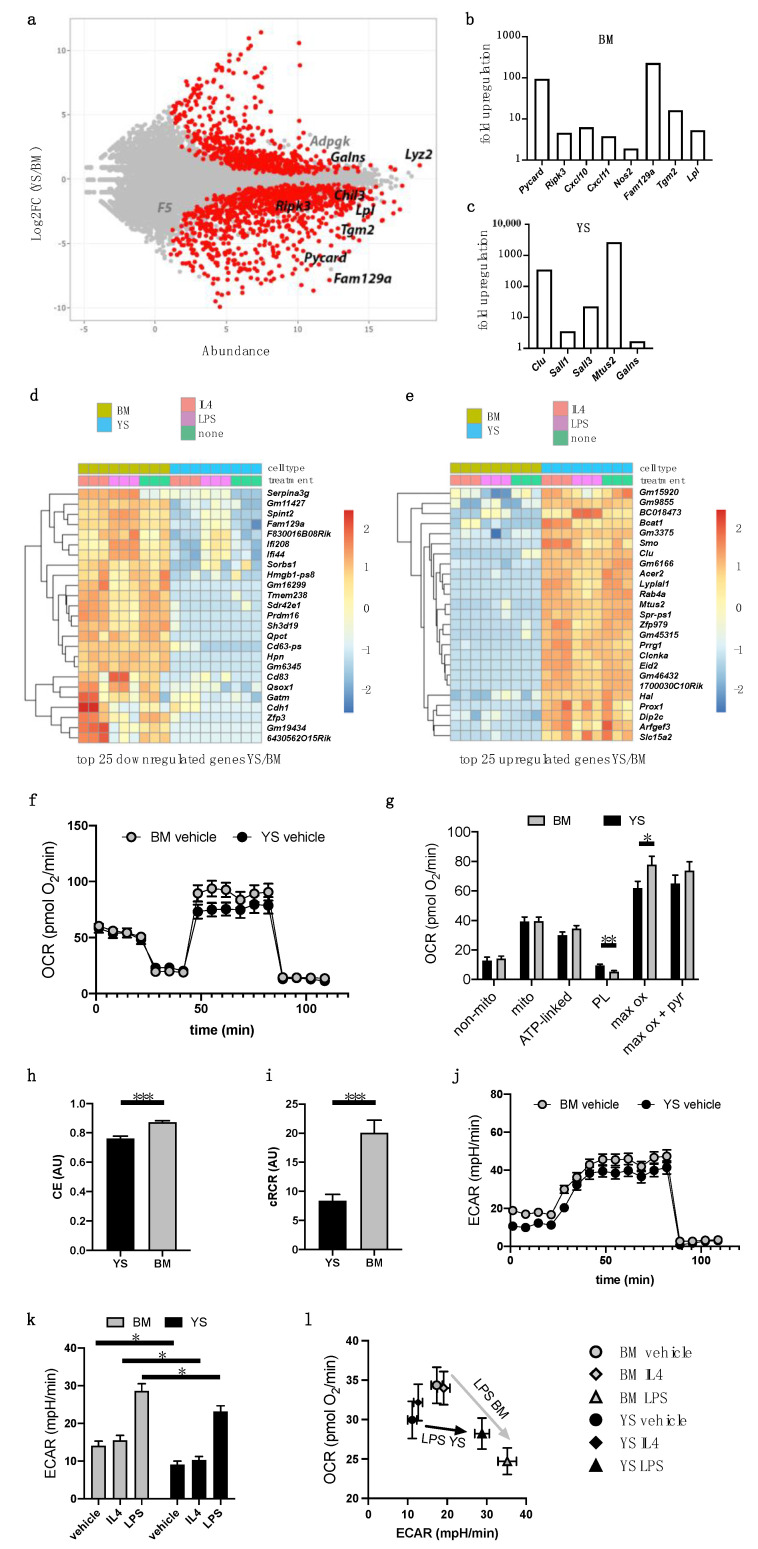
Figure 3.
Transcriptome and extracellular flux analysis. (a–e) RNA expression analysis of differentiated YS and BM Hoxb8 macrophages. (a) MA plot of macrophage gene expression indicating fold changes (log2) of YS versus BM plotted against abundance (logTPM). Genes are marked in grey (not significant) or black (significant). (b,c) Fold upregulation of selected genes in (b) BM- and (c) YS-derived macrophages. Top 25 (d) upregulated and (e) downregulated genes of YS versus BM Hoxb8 cells without treatment or stimulated with IL4 or LPS. (f–l) Bioenergetic profiling of Hoxb8 macrophages either stimulated or not stimulated with IL4 or LPS for 4 h using XF96 extracellular flux analyzer as described in the Methods section. All data represent the mean of 26–29 wells measured on three independent experimental days and are normalized to 130 ng ds DNA/well, two-way ANOVA, followed by Sidak post hoc test. (f) Oxygen consumption rates (OCR) traces of unstimulated BM and YS macrophages using respiratory inhibitors to probe bioenergetic modules. (g) Respiratory modules of mitochondrial energy transduction in unstimulated and stimulated cells. (h) Mitochondrial efficiency. Coupling efficiency (CE) is the respiratory fraction driving ATP synthesis at resting state; (i) cellular respiratory control ratio (cRCR) is determined using proton leak and uncoupler-induced respiration. (j) Extracellular acidification rate (ECAR) traces of unstimulated BM and YS macrophages using specific inhibitors. (k) ECAR linked to glycolytic activity of unstimulated and stimulated macrophages. (l) Glycolytic ECAR plotted against ATP-linked OCR to depict global changes in cellular energy metabolism, revealing the metabolic switch induced by LPS in BM Hoxb8 macrophages. (***) p < 0.001, (**) p < 0.01, (*) p < 0.05.

